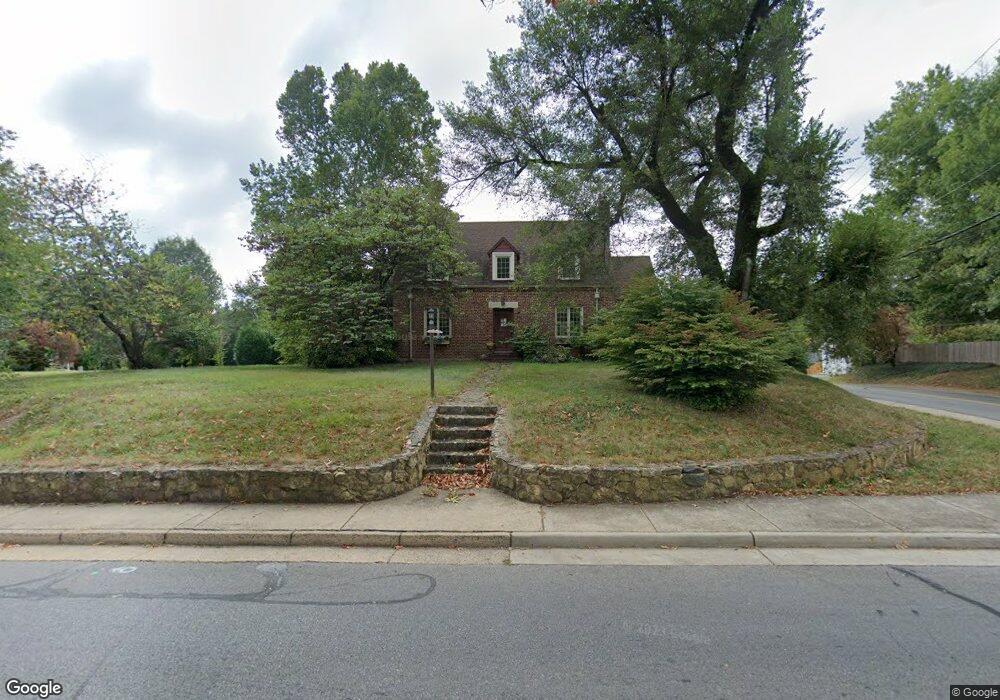
924 Lyndhurst Rd Waynesboro, VA 22980
Estimated Value: $339,000 - $362,000
3
Beds
3
Baths
2,345
Sq Ft
$151/Sq Ft
Est. Value
About This Home
This home is located at 924 Lyndhurst Rd, Waynesboro, VA 22980 and is currently estimated at $353,425, approximately $150 per square foot. 924 Lyndhurst Rd is a home located in Waynesboro City with nearby schools including Berkeley Glenn Elementary School, Kate Collins Middle School, and Waynesboro High School.
Ownership History
Date
Name
Owned For
Owner Type
Purchase Details
Closed on
Jul 21, 2021
Sold by
Towler Sam C
Bought by
Towler Sam C and The Sam C Towler Trust
Current Estimated Value
Purchase Details
Closed on
Jun 1, 2018
Sold by
Conely Melissa
Bought by
Towler Sam C
Home Financials for this Owner
Home Financials are based on the most recent Mortgage that was taken out on this home.
Original Mortgage
$183,600
Outstanding Balance
$158,424
Interest Rate
4.4%
Mortgage Type
New Conventional
Estimated Equity
$195,001
Purchase Details
Closed on
Oct 10, 2012
Sold by
Steed Cynthia A
Bought by
Conley Melissa
Home Financials for this Owner
Home Financials are based on the most recent Mortgage that was taken out on this home.
Original Mortgage
$131,000
Interest Rate
3.59%
Mortgage Type
New Conventional
Create a Home Valuation Report for This Property
The Home Valuation Report is an in-depth analysis detailing your home's value as well as a comparison with similar homes in the area
Home Values in the Area
Average Home Value in this Area
Purchase History
| Date | Buyer | Sale Price | Title Company |
|---|---|---|---|
| Towler Sam C | -- | None Available | |
| Towler Sam C | $229,900 | Attorney | |
| Conley Melissa | $192,500 | -- |
Source: Public Records
Mortgage History
| Date | Status | Borrower | Loan Amount |
|---|---|---|---|
| Open | Towler Sam C | $183,600 | |
| Previous Owner | Conley Melissa | $131,000 |
Source: Public Records
Tax History Compared to Growth
Tax History
| Year | Tax Paid | Tax Assessment Tax Assessment Total Assessment is a certain percentage of the fair market value that is determined by local assessors to be the total taxable value of land and additions on the property. | Land | Improvement |
|---|---|---|---|---|
| 2025 | $2,628 | $320,500 | $60,000 | $260,500 |
| 2024 | $2,272 | $295,000 | $55,000 | $240,000 |
| 2023 | $2,272 | $295,000 | $55,000 | $240,000 |
| 2022 | $1,974 | $219,300 | $55,000 | $164,300 |
| 2021 | $1,974 | $219,300 | $55,000 | $164,300 |
| 2020 | $1,856 | $206,200 | $55,000 | $151,200 |
| 2019 | $1,856 | $206,200 | $55,000 | $151,200 |
| 2018 | $1,489 | $165,400 | $55,000 | $110,400 |
| 2017 | $1,439 | $165,400 | $55,000 | $110,400 |
| 2016 | $1,368 | $171,000 | $55,000 | $116,000 |
| 2015 | $1,368 | $171,000 | $55,000 | $116,000 |
| 2014 | -- | $162,800 | $55,000 | $107,800 |
| 2013 | -- | $0 | $0 | $0 |
Source: Public Records
Map
Nearby Homes
- 844 Lyndhurst Rd
- 833 Jefferson Ave
- 645 Maple Ave
- 701 Western Rd
- 548 Pine Ave
- 705 Oak Ave
- 477 Chestnut Ave
- 528 Arch Ave
- 314 13th St
- 1215 W 12th St
- 529 S Linden Ave
- 373 S Magnolia Ave
- 1358 Keesling Ave
- 407 Crompton Rd
- 1013 Ohio St
- 812 Meadowbrook Rd
- 329 S Winchester Ave
- 636 Rosser Ave
- 1220 Chatham Rd
- 229 S Winchester Ave
- 912 Lyndhurst Rd
- 925 Woodrow Ave
- 908 Lyndhurst Rd
- 943 Lyndhurst Rd
- 947 Woodrow Ave
- 913 Woodrow Ave
- 1000 Lyndhurst Rd
- 901 Lyndhurst Rd
- 900 Lyndhurst Rd
- 907 Woodrow Ave
- 1001 Lyndhurst Rd
- 1001 Woodrow Ave
- 1009 Lyndhurst Rd
- 836 Lyndhurst Rd
- 1009 Woodrow Ave
- 847 Woodrow Ave
- 916 Woodrow Ave
- 908 Woodrow Ave
- 1016 Lyndhurst Rd
- 1019 Lyndhurst Rd