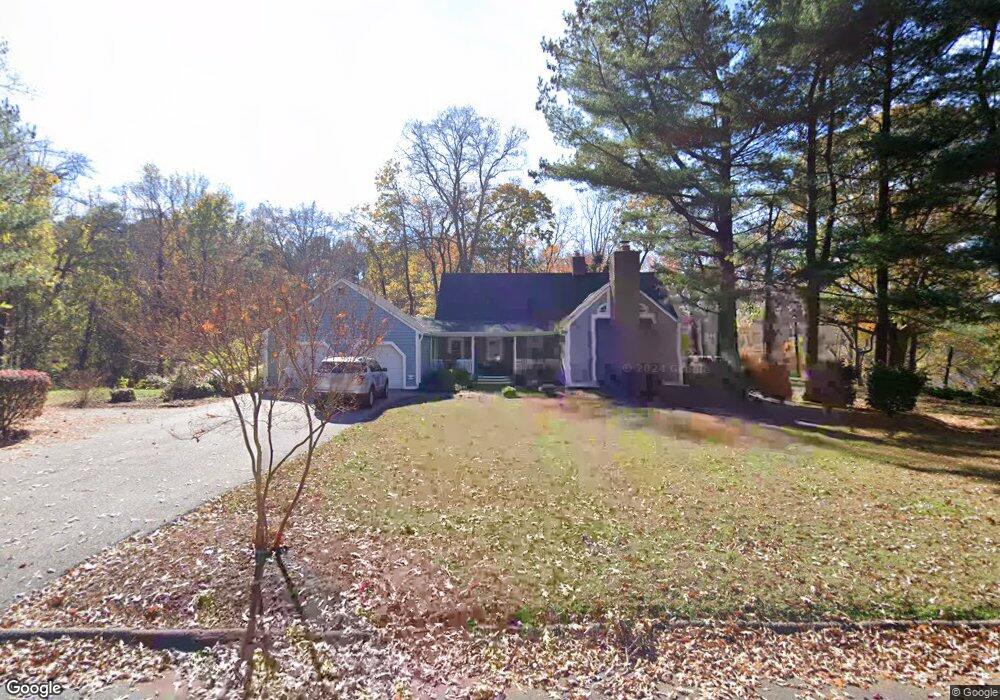
924 Placid Ct Arnold, MD 21012
Estimated Value: $1,021,940 - $1,301,000
Studio
2
Baths
2,200
Sq Ft
$529/Sq Ft
Est. Value
About This Home
This home is located at 924 Placid Ct, Arnold, MD 21012 and is currently estimated at $1,162,735, approximately $528 per square foot. 924 Placid Ct is a home located in Anne Arundel County with nearby schools including Broadneck Elementary School, Magothy River Middle School, and Broadneck High School.
Ownership History
Date
Name
Owned For
Owner Type
Purchase Details
Closed on
Mar 25, 2016
Sold by
Skipp Stefan Rogers
Bought by
Skipp Stefan Rogers and Davis Deborah R
Current Estimated Value
Purchase Details
Closed on
Feb 16, 2007
Sold by
Skipp Stefan R
Bought by
Skipp Stefan R
Purchase Details
Closed on
Feb 14, 2007
Sold by
Skipp Stefan R
Bought by
Skipp Stefan R
Purchase Details
Closed on
Oct 6, 1992
Sold by
Whitehead Jerry W
Bought by
Skipp Stefan R
Home Financials for this Owner
Home Financials are based on the most recent Mortgage that was taken out on this home.
Original Mortgage
$400,000
Interest Rate
7.93%
Purchase Details
Closed on
Dec 11, 1987
Sold by
Hume Dixon L
Bought by
Whitehead Jerry W
Home Financials for this Owner
Home Financials are based on the most recent Mortgage that was taken out on this home.
Original Mortgage
$300,000
Interest Rate
10.66%
Create a Home Valuation Report for This Property
The Home Valuation Report is an in-depth analysis detailing your home's value as well as a comparison with similar homes in the area
Home Values in the Area
Average Home Value in this Area
Purchase History
| Date | Buyer | Sale Price | Title Company |
|---|---|---|---|
| Skipp Stefan Rogers | -- | Attorney | |
| Skipp Stefan R | -- | -- | |
| Skipp Stefan R | -- | -- | |
| Skipp Stefan R | $559,500 | -- | |
| Whitehead Jerry W | $310,000 | -- |
Source: Public Records
Mortgage History
| Date | Status | Borrower | Loan Amount |
|---|---|---|---|
| Previous Owner | Skipp Stefan R | $400,000 | |
| Previous Owner | Whitehead Jerry W | $300,000 |
Source: Public Records
Tax History
| Year | Tax Paid | Tax Assessment Tax Assessment Total Assessment is a certain percentage of the fair market value that is determined by local assessors to be the total taxable value of land and additions on the property. | Land | Improvement |
|---|---|---|---|---|
| 2025 | $6,874 | $685,100 | -- | -- |
| 2024 | $6,874 | $651,600 | $380,300 | $271,300 |
| 2023 | $6,713 | $647,867 | $0 | $0 |
| 2022 | $6,298 | $644,133 | $0 | $0 |
| 2020 | $6,057 | $640,400 | $380,300 | $260,100 |
| 2019 | $5,965 | $640,400 | $380,300 | $260,100 |
| 2018 | $6,938 | $684,200 | $452,300 | $231,900 |
| 2017 | $5,669 | $673,767 | $0 | $0 |
| 2016 | -- | $663,333 | $0 | $0 |
| 2015 | -- | $652,900 | $0 | $0 |
| 2014 | -- | $642,767 | $0 | $0 |
Source: Public Records
Map
Nearby Homes
- 404 Alameda Pkwy
- 889 Lynch Dr
- 559 Melissa Ct
- 342 Buena Vista Ave
- 903 Pine Trail
- 308 Clifton Ave
- 319 Alameda Pkwy
- 805 Barrett Ave
- 856 Imperial Rd
- 930 Whitstable Blvd
- 854 Imperial Rd
- 303 Ternwing Dr
- 413 Ridgeview Ct
- 852 Birchwood Ct
- 508 Bay Hills Dr
- 1233 Birchcrest Ct
- 1078 Brightleaf Ct
- 312 Rosslare Dr
- 797 David Dr
- 434 College Pkwy
Your Personal Tour Guide
Ask me questions while you tour the home.