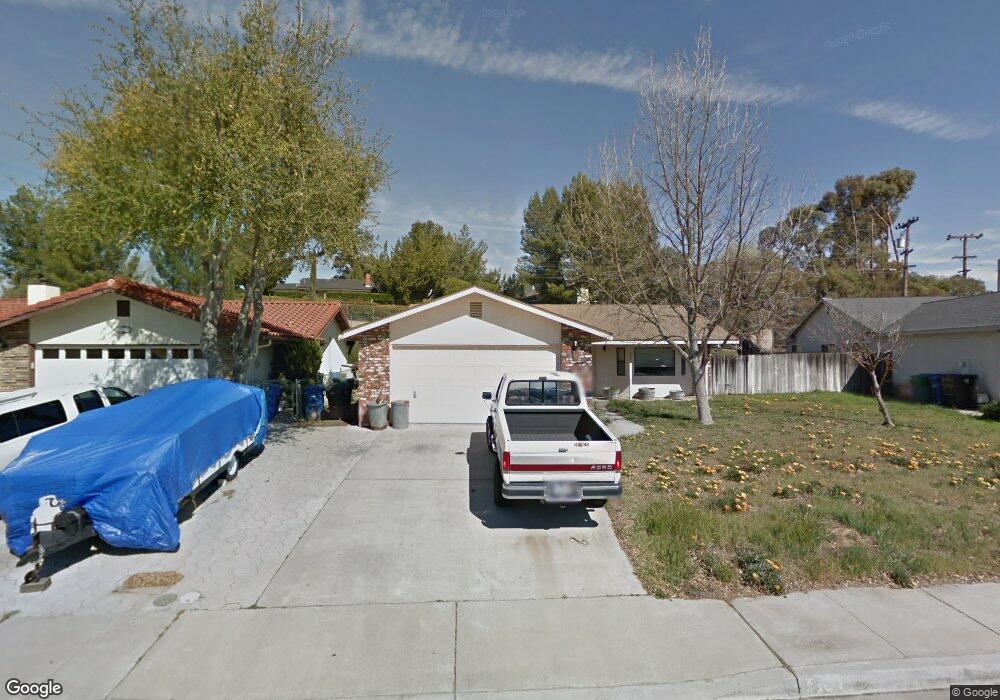
924 Player Ln Paso Robles, CA 93446
Estimated Value: $571,069 - $679,000
3
Beds
2
Baths
1,334
Sq Ft
$473/Sq Ft
Est. Value
About This Home
This home is located at 924 Player Ln, Paso Robles, CA 93446 and is currently estimated at $631,017, approximately $473 per square foot. 924 Player Ln is a home located in San Luis Obispo County with nearby schools including Pat Butler Elementary School, George H. Flamson Middle School, and Paso Robles High School.
Ownership History
Date
Name
Owned For
Owner Type
Purchase Details
Closed on
Jan 14, 2005
Sold by
Flickinger Lanny Alan
Bought by
The Lanny Alan Flickinger Living Trust
Current Estimated Value
Purchase Details
Closed on
Dec 26, 2002
Sold by
Flickinger Sharon L
Bought by
Flickinger Lanny Alan
Home Financials for this Owner
Home Financials are based on the most recent Mortgage that was taken out on this home.
Original Mortgage
$80,000
Interest Rate
5.96%
Create a Home Valuation Report for This Property
The Home Valuation Report is an in-depth analysis detailing your home's value as well as a comparison with similar homes in the area
Purchase History
| Date | Buyer | Sale Price | Title Company |
|---|---|---|---|
| The Lanny Alan Flickinger Living Trust | -- | -- | |
| Flickinger Lanny Alan | -- | Fidelity Title Company |
Source: Public Records
Mortgage History
| Date | Status | Borrower | Loan Amount |
|---|---|---|---|
| Closed | Flickinger Lanny Alan | $80,000 |
Source: Public Records
Tax History
| Year | Tax Paid | Tax Assessment Tax Assessment Total Assessment is a certain percentage of the fair market value that is determined by local assessors to be the total taxable value of land and additions on the property. | Land | Improvement |
|---|---|---|---|---|
| 2025 | $1,817 | $173,883 | $60,672 | $113,211 |
| 2024 | $1,786 | $170,475 | $59,483 | $110,992 |
| 2023 | $1,786 | $167,133 | $58,317 | $108,816 |
| 2022 | $1,758 | $163,857 | $57,174 | $106,683 |
| 2021 | $1,727 | $160,645 | $56,053 | $104,592 |
| 2020 | $1,702 | $158,999 | $55,479 | $103,520 |
| 2019 | $1,677 | $155,883 | $54,392 | $101,491 |
| 2018 | $1,652 | $152,827 | $53,326 | $99,501 |
| 2017 | $1,552 | $149,831 | $52,281 | $97,550 |
| 2016 | $1,520 | $146,894 | $51,256 | $95,638 |
| 2015 | $1,513 | $144,689 | $50,487 | $94,202 |
| 2014 | $1,459 | $141,856 | $49,499 | $92,357 |
Source: Public Records
Map
Nearby Homes
- 834 Nicklaus St
- 818 Wade Dr
- 1736 Wade Dr
- 1020 Par Ave
- 940 Austin Ct
- 919 Saint Ann Dr
- 795 Angus St
- 18 Flag Way
- 615 Palomino Cir
- 829 Saint Andrews Cir
- 749 Jersey Ct
- 901 Sleepy Hollow Rd
- 505 Melody Dr
- 1309 Stoney Creek Rd
- 358 Via Ramona
- 1340 Stoney Creek Rd
- 268 Camino Lobo
- 1720 Willowbank Ln
- 4 Dove Ct
- 1719 Willowbank Ln
Your Personal Tour Guide
Ask me questions while you tour the home.