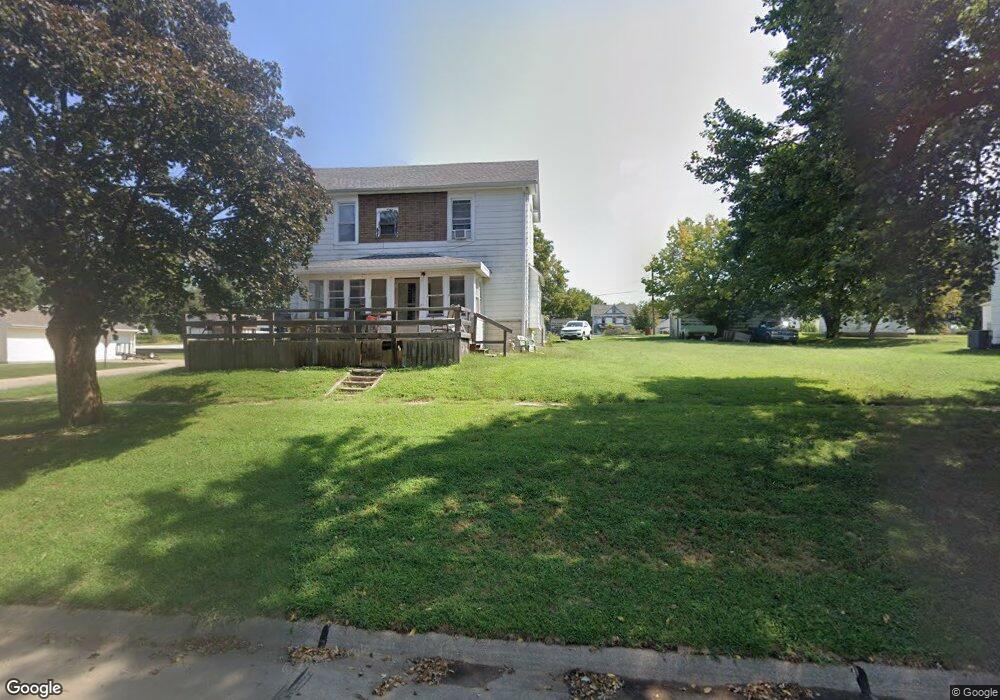
924 Wilson St Falls City, NE 68355
Estimated Value: $57,000 - $97,000
3
Beds
2
Baths
1,603
Sq Ft
$44/Sq Ft
Est. Value
About This Home
This home is located at 924 Wilson St, Falls City, NE 68355 and is currently estimated at $71,060, approximately $44 per square foot. 924 Wilson St is a home located in Richardson County with nearby schools including Falls City North Elementary School, Falls City South Elementary School, and Falls City Middle School.
Ownership History
Date
Name
Owned For
Owner Type
Purchase Details
Closed on
Nov 18, 2009
Sold by
Catlin Bradley and Catlin Sandra
Bought by
Gresham Robert D and Gresham Sherry M
Current Estimated Value
Purchase Details
Closed on
Nov 17, 2009
Sold by
Catlin Bradley and Catlin Sandra
Bought by
Gresham Robert D and Gresham Sherry M
Purchase Details
Closed on
Oct 7, 2004
Sold by
Deutsche Bank National Trust Co
Bought by
Catlin Bradley and Catlin Sandra
Purchase Details
Closed on
Jan 21, 2004
Sold by
Huppert Mary Kay
Bought by
Deutsche Bank National Trust Co
Create a Home Valuation Report for This Property
The Home Valuation Report is an in-depth analysis detailing your home's value as well as a comparison with similar homes in the area
Home Values in the Area
Average Home Value in this Area
Purchase History
| Date | Buyer | Sale Price | Title Company |
|---|---|---|---|
| Gresham Robert D | $25,000 | -- | |
| Gresham Robert D | -- | -- | |
| Catlin Bradley | $13,000 | -- | |
| Deutsche Bank National Trust Co | $20,600 | -- |
Source: Public Records
Tax History Compared to Growth
Tax History
| Year | Tax Paid | Tax Assessment Tax Assessment Total Assessment is a certain percentage of the fair market value that is determined by local assessors to be the total taxable value of land and additions on the property. | Land | Improvement |
|---|---|---|---|---|
| 2025 | $361 | $34,159 | $4,500 | $29,659 |
| 2024 | $361 | $32,480 | $4,500 | $27,980 |
| 2023 | $725 | $44,198 | $4,500 | $39,698 |
| 2022 | $798 | $41,545 | $3,240 | $38,305 |
| 2021 | $732 | $39,098 | $3,240 | $35,858 |
| 2020 | $708 | $37,390 | $3,240 | $34,150 |
| 2019 | $700 | $36,395 | $3,240 | $33,155 |
| 2018 | $688 | $35,429 | $3,240 | $32,189 |
| 2017 | $689 | $35,429 | $3,240 | $32,189 |
| 2016 | $668 | $34,491 | $3,240 | $31,251 |
| 2015 | $670 | $34,491 | $3,240 | $31,251 |
| 2014 | $669 | $34,491 | $3,240 | $31,251 |
Source: Public Records
Map
Nearby Homes