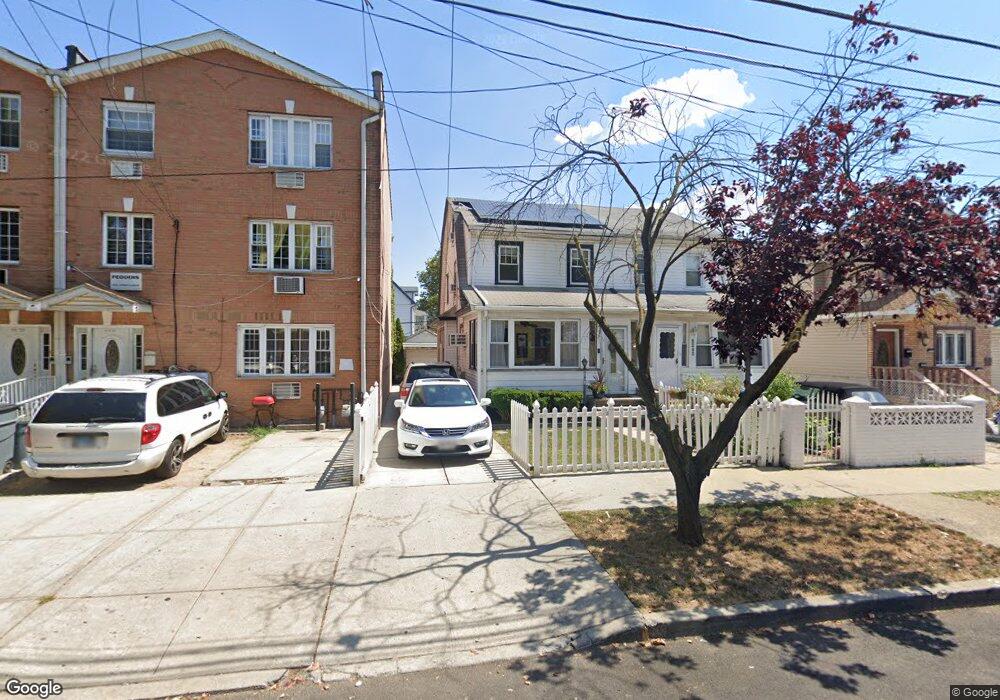
9241 175th St Jamaica, NY 11433
Jamaica NeighborhoodEstimated Value: $638,383 - $839,000
--
Bed
--
Bath
1,372
Sq Ft
$530/Sq Ft
Est. Value
About This Home
This home is located at 9241 175th St, Jamaica, NY 11433 and is currently estimated at $726,846, approximately $529 per square foot. 9241 175th St is a home located in Queens County with nearby schools including P.S./I.S. 116 William C Hughley, I.S. 238 Susan B Anthony Academy, and Immaculate Conception Catholic Academy.
Ownership History
Date
Name
Owned For
Owner Type
Purchase Details
Closed on
Sep 15, 2015
Sold by
Khan Emran and Khan Shanaz
Bought by
Khan Shanaz and Khan Shaneeza
Current Estimated Value
Home Financials for this Owner
Home Financials are based on the most recent Mortgage that was taken out on this home.
Original Mortgage
$277,500
Outstanding Balance
$217,133
Interest Rate
3.88%
Mortgage Type
New Conventional
Estimated Equity
$509,713
Purchase Details
Closed on
Feb 11, 2008
Sold by
Khan Fareena
Bought by
Khan Emran S and Khan Shanaz
Purchase Details
Closed on
Nov 11, 1996
Sold by
Rojan David and Rojan Bibi S
Bought by
Khan Fareena
Home Financials for this Owner
Home Financials are based on the most recent Mortgage that was taken out on this home.
Original Mortgage
$90,000
Interest Rate
7.36%
Purchase Details
Closed on
Mar 31, 1994
Sold by
Kamaludin Fadia
Bought by
Rojan David and Rojan Bibi S
Create a Home Valuation Report for This Property
The Home Valuation Report is an in-depth analysis detailing your home's value as well as a comparison with similar homes in the area
Home Values in the Area
Average Home Value in this Area
Purchase History
| Date | Buyer | Sale Price | Title Company |
|---|---|---|---|
| Khan Shanaz | -- | -- | |
| Khan Shanaz | -- | -- | |
| Khan Emran S | -- | -- | |
| Khan Emran S | -- | -- | |
| Khan Fareena | -- | Stewart Title Insurance Co | |
| Khan Fareena | -- | Stewart Title Insurance Co | |
| Rojan David | -- | Title Usa Insurance Corp | |
| Rojan David | -- | Title Usa Insurance Corp |
Source: Public Records
Mortgage History
| Date | Status | Borrower | Loan Amount |
|---|---|---|---|
| Open | Khan Shanaz | $277,500 | |
| Closed | Khan Shanaz | $277,500 | |
| Previous Owner | Khan Fareena | $90,000 |
Source: Public Records
Tax History Compared to Growth
Tax History
| Year | Tax Paid | Tax Assessment Tax Assessment Total Assessment is a certain percentage of the fair market value that is determined by local assessors to be the total taxable value of land and additions on the property. | Land | Improvement |
|---|---|---|---|---|
| 2025 | $4,318 | $22,786 | $6,431 | $16,355 |
| 2024 | $4,318 | $21,497 | $6,897 | $14,600 |
| 2023 | $4,274 | $21,280 | $5,806 | $15,474 |
| 2022 | $3,131 | $41,940 | $11,820 | $30,120 |
| 2021 | $3,115 | $38,940 | $11,820 | $27,120 |
| 2020 | $3,138 | $33,480 | $11,820 | $21,660 |
| 2019 | $2,866 | $33,360 | $11,820 | $21,540 |
| 2018 | $3,615 | $17,733 | $6,629 | $11,104 |
| 2017 | $3,414 | $16,748 | $8,008 | $8,740 |
| 2016 | $3,163 | $16,748 | $8,008 | $8,740 |
| 2015 | $1,906 | $15,823 | $9,265 | $6,558 |
| 2014 | $1,906 | $14,929 | $8,093 | $6,836 |
Source: Public Records
Map
Nearby Homes
- 17508 93rd Ave
- 177 E 93rd St Unit 3B
- 9071 178th St
- 172-18 Jamaica Ave Unit 2-B
- 90-43 176th St
- 9041 178th St
- 90-29 178th St
- 10331 177th St
- 90-11 179th St
- 104-07 177th St
- 175-26 89th Ave Unit D
- 173-61 105th Ave
- 17207a 90th Ave
- 168-63 93rd Ave
- 173-12 89th Ave
- 89-06 175th St
- 9037 180th St
- 10326 171st St
- 177-53 105th Ave
- 16823 93rd Ave
- 9243 175th St
- 9233 175th St
- 9233 175th St
- 9245 175th St
- 9231 175th St
- 92-31 175th St
- 9247 175th St
- 92-32 176th St Unit 1
- 9232 176th St
- 9229 175th St
- 9238 176th St
- 92-38 176th St Unit 2nd FL
- 92-38 176th St Unit 1 FL
- 92-38 176th St
- 92-38A 176th St
- 9251 175th St
- 92-51 175th St
- 17511 93rd Ave
- 9228 176th St
- 17513 93rd Ave