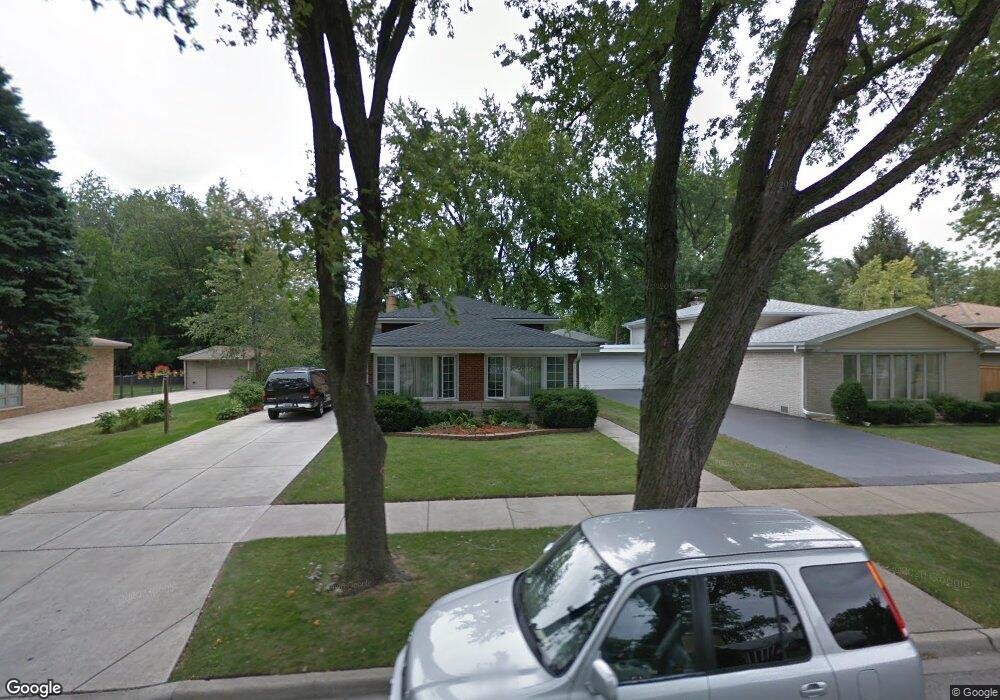
9241 Parkside Ave Morton Grove, IL 60053
Estimated Value: $450,205 - $609,000
3
Beds
2
Baths
1,287
Sq Ft
$387/Sq Ft
Est. Value
About This Home
This home is located at 9241 Parkside Ave, Morton Grove, IL 60053 and is currently estimated at $498,551, approximately $387 per square foot. 9241 Parkside Ave is a home located in Cook County with nearby schools including Park View Elementary School, Niles West High School, and Mesivta Shaarei Adirim.
Ownership History
Date
Name
Owned For
Owner Type
Purchase Details
Closed on
Jun 21, 2004
Sold by
Walsh Michael J and Katsnelson Mila
Bought by
Micor Christian J and Milcor Emilie M
Current Estimated Value
Home Financials for this Owner
Home Financials are based on the most recent Mortgage that was taken out on this home.
Original Mortgage
$289,600
Outstanding Balance
$134,400
Interest Rate
5.25%
Mortgage Type
Unknown
Estimated Equity
$364,151
Purchase Details
Closed on
Sep 26, 1997
Sold by
Israel Laurel E and Israel Norman L
Bought by
Walsh Michael J and Katsnelson Mila
Home Financials for this Owner
Home Financials are based on the most recent Mortgage that was taken out on this home.
Original Mortgage
$194,750
Interest Rate
7.43%
Purchase Details
Closed on
May 5, 1997
Sold by
Israel Norman L and Israel Laurel E
Bought by
Israel Laurel E and Israel Norman L
Create a Home Valuation Report for This Property
The Home Valuation Report is an in-depth analysis detailing your home's value as well as a comparison with similar homes in the area
Home Values in the Area
Average Home Value in this Area
Purchase History
| Date | Buyer | Sale Price | Title Company |
|---|---|---|---|
| Micor Christian J | $362,000 | First American Title | |
| Walsh Michael J | $205,000 | -- | |
| Israel Laurel E | -- | -- |
Source: Public Records
Mortgage History
| Date | Status | Borrower | Loan Amount |
|---|---|---|---|
| Open | Micor Christian J | $289,600 | |
| Previous Owner | Walsh Michael J | $194,750 |
Source: Public Records
Tax History Compared to Growth
Tax History
| Year | Tax Paid | Tax Assessment Tax Assessment Total Assessment is a certain percentage of the fair market value that is determined by local assessors to be the total taxable value of land and additions on the property. | Land | Improvement |
|---|---|---|---|---|
| 2024 | $8,846 | $33,942 | $8,844 | $25,098 |
| 2023 | $9,241 | $33,942 | $8,844 | $25,098 |
| 2022 | $9,241 | $37,000 | $8,844 | $28,156 |
| 2021 | $8,008 | $28,296 | $5,442 | $22,854 |
| 2020 | $7,866 | $28,296 | $5,442 | $22,854 |
| 2019 | $7,942 | $31,794 | $5,442 | $26,352 |
| 2018 | $7,601 | $27,525 | $4,932 | $22,593 |
| 2017 | $7,677 | $27,525 | $4,932 | $22,593 |
| 2016 | $7,500 | $27,525 | $4,932 | $22,593 |
| 2015 | $6,546 | $22,937 | $4,251 | $18,686 |
| 2014 | $6,557 | $22,937 | $4,251 | $18,686 |
| 2013 | $6,388 | $22,937 | $4,251 | $18,686 |
Source: Public Records
Map
Nearby Homes
- 9234 Central Ave
- 5644 Lyons St
- 5449 Arcadia St
- 9224 Menard Ave
- 9314 Menard Ave
- 9320 Menard Ave
- 8918 Parkside Ave
- 5536 Greenwood St
- 5459 Suffield Ct
- 9539 Lorel Ave
- 5352 Greenwood St
- 8841 Menard Ave
- 8836 Mansfield Ave
- 5247 Suffield Ct
- 9508 Leamington Ave
- 9655 Woods Dr Unit P350
- 9655 Woods Dr Unit 1809
- 9715 Woods Dr Unit 903
- 9715 Woods Dr Unit 1104
- 9725 Woods Dr Unit 1913
- 9237 Parkside Ave
- 9249 Parkside Ave
- 9233 Parkside Ave
- 9238 Central Ave
- 9238 Central Ave
- 9303 Parkside Ave
- 9250 Central Ave
- 9225 Parkside Ave
- 9230 Central Ave
- 9230 Central Ave
- 9238 Parkside Ave
- 9302 Central Ave
- 9234 Parkside Ave
- 9250 Parkside Ave
- 9224 Central Ave
- 9224 Central Ave
- 9309 Parkside Ave
- 9228 Parkside Ave
- 9223 Parkside Ave
- 9223 Parkside Ave