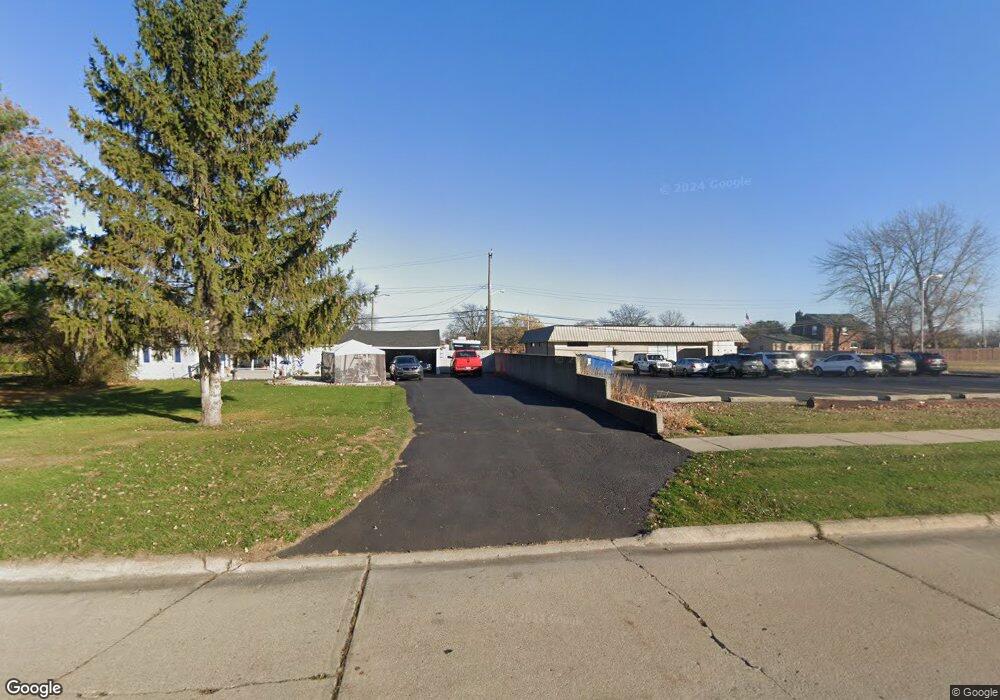
9243 Banner St Taylor, MI 48180
Estimated Value: $124,057 - $210,000
Studio
--
Bath
1,093
Sq Ft
$151/Sq Ft
Est. Value
About This Home
This home is located at 9243 Banner St, Taylor, MI 48180 and is currently estimated at $164,764, approximately $150 per square foot. 9243 Banner St is a home located in Wayne County with nearby schools including Holland Elementary School, Hoover Middle School, and Taylor High School.
Ownership History
Date
Name
Owned For
Owner Type
Purchase Details
Closed on
Sep 14, 2015
Sold by
Bondy Watson Donna and Bondy Donna
Bought by
Bondy Donna G
Current Estimated Value
Home Financials for this Owner
Home Financials are based on the most recent Mortgage that was taken out on this home.
Original Mortgage
$81,410
Interest Rate
3.93%
Mortgage Type
New Conventional
Purchase Details
Closed on
Aug 18, 2015
Sold by
Bondy James
Bought by
Bondy Watson Donna
Home Financials for this Owner
Home Financials are based on the most recent Mortgage that was taken out on this home.
Original Mortgage
$81,410
Interest Rate
3.93%
Mortgage Type
New Conventional
Create a Home Valuation Report for This Property
The Home Valuation Report is an in-depth analysis detailing your home's value as well as a comparison with similar homes in the area
Home Values in the Area
Average Home Value in this Area
Purchase History
| Date | Buyer | Sale Price | Title Company |
|---|---|---|---|
| Bondy Donna G | -- | Mbt Title Services Llc | |
| Bondy Watson Donna | -- | Mbt Title Services Llc |
Source: Public Records
Mortgage History
| Date | Status | Borrower | Loan Amount |
|---|---|---|---|
| Closed | Bondy Donna G | $81,410 | |
| Closed | Bondy Watson Donna | $81,410 |
Source: Public Records
Tax History
| Year | Tax Paid | Tax Assessment Tax Assessment Total Assessment is a certain percentage of the fair market value that is determined by local assessors to be the total taxable value of land and additions on the property. | Land | Improvement |
|---|---|---|---|---|
| 2025 | $1,685 | $64,900 | $0 | $0 |
| 2024 | $1,631 | $57,900 | $0 | $0 |
| 2023 | $2,024 | $58,100 | $0 | $0 |
| 2022 | $1,557 | $49,000 | $0 | $0 |
| 2021 | $1,794 | $41,700 | $0 | $0 |
| 2020 | $1,777 | $40,600 | $0 | $0 |
| 2019 | $177,761 | $43,900 | $0 | $0 |
| 2018 | $1,337 | $33,000 | $0 | $0 |
| 2017 | $953 | $30,700 | $0 | $0 |
| 2016 | $1,769 | $30,200 | $0 | $0 |
| 2015 | $3,234 | $35,500 | $0 | $0 |
| 2013 | $3,133 | $35,700 | $0 | $0 |
| 2012 | $1,137 | $35,300 | $21,100 | $14,200 |
Source: Public Records
Map
Nearby Homes
- 0000 Wick Rd
- 9602 Cornell St
- 23760 Mary St
- 9360 Pine St
- 9731 Cornell St
- 9788 Pine St
- 011 Pine St
- 01 Pine St
- 9712 Cherokee St
- 8210 Westpoint St
- 24920 Chernick St
- 9228 Mueller St
- 23353 Wohlfeil St
- 25315 Baker St
- 9167 Groschner St
- 8279 Elm St
- 8303 Birch St
- 8350 Gulley St
- 9651 Blaty St
- 9560 Sylvester St
Your Personal Tour Guide
Ask me questions while you tour the home.