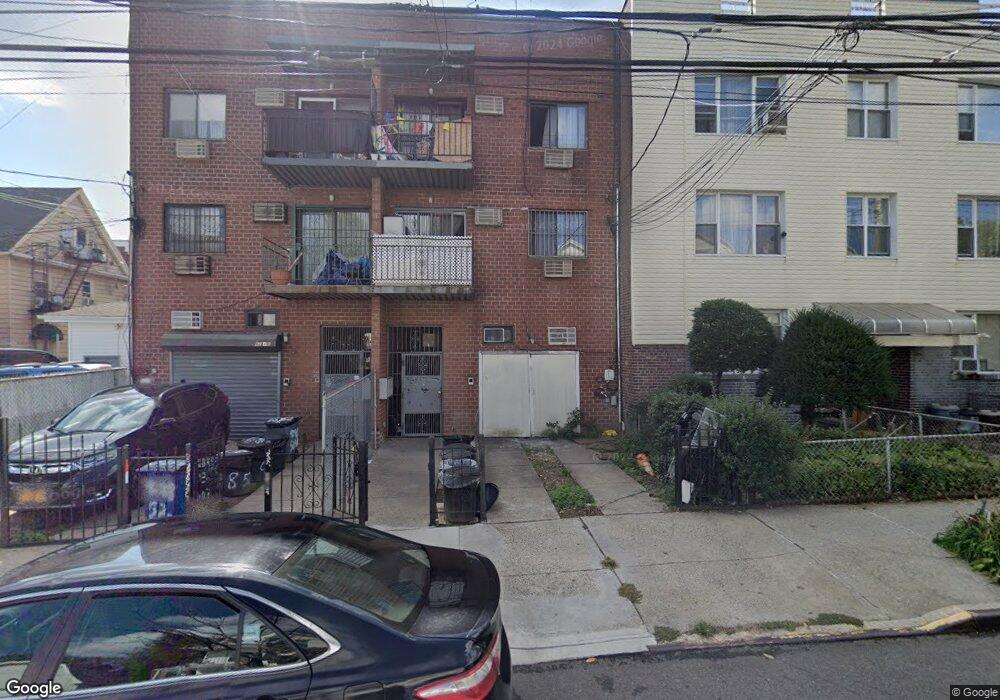
9246 52nd Ave Unit 1B Elmhurst, NY 11373
Elmhurst NeighborhoodEstimated Value: $601,000 - $745,000
--
Bed
--
Bath
1,283
Sq Ft
$536/Sq Ft
Est. Value
About This Home
This home is located at 9246 52nd Ave Unit 1B, Elmhurst, NY 11373 and is currently estimated at $687,048, approximately $535 per square foot. 9246 52nd Ave Unit 1B is a home located in Queens County with nearby schools including P.S. 13 Clement C Moore, I.S. 093 Ridgewood, and Joseph F. Quinn Intermediate School 77.
Ownership History
Date
Name
Owned For
Owner Type
Purchase Details
Closed on
Jan 9, 2014
Sold by
Huang Chai Xiang
Bought by
Wang Steve Xiaodong and Zhou Hong
Current Estimated Value
Home Financials for this Owner
Home Financials are based on the most recent Mortgage that was taken out on this home.
Original Mortgage
$300,000
Outstanding Balance
$227,004
Interest Rate
4.45%
Mortgage Type
New Conventional
Estimated Equity
$460,044
Purchase Details
Closed on
Nov 10, 2009
Sold by
Hung Amy H
Bought by
Huang Chai Xiang
Home Financials for this Owner
Home Financials are based on the most recent Mortgage that was taken out on this home.
Original Mortgage
$216,000
Interest Rate
4.86%
Mortgage Type
Purchase Money Mortgage
Purchase Details
Closed on
Mar 14, 2002
Sold by
Feng Shu-Ching
Bought by
Hung Amy H
Purchase Details
Closed on
Sep 19, 1997
Sold by
Ocwen Federal Bank Fsb
Bought by
Feng Shu Ching
Create a Home Valuation Report for This Property
The Home Valuation Report is an in-depth analysis detailing your home's value as well as a comparison with similar homes in the area
Home Values in the Area
Average Home Value in this Area
Purchase History
| Date | Buyer | Sale Price | Title Company |
|---|---|---|---|
| Wang Steve Xiaodong | $400,000 | -- | |
| Huang Chai Xiang | $356,000 | -- | |
| Hung Amy H | -- | -- | |
| Feng Shu Ching | $43,000 | -- |
Source: Public Records
Mortgage History
| Date | Status | Borrower | Loan Amount |
|---|---|---|---|
| Open | Wang Steve Xiaodong | $300,000 | |
| Previous Owner | Huang Chai Xiang | $216,000 |
Source: Public Records
Tax History Compared to Growth
Tax History
| Year | Tax Paid | Tax Assessment Tax Assessment Total Assessment is a certain percentage of the fair market value that is determined by local assessors to be the total taxable value of land and additions on the property. | Land | Improvement |
|---|---|---|---|---|
| 2025 | $3,521 | $17,663 | $402 | $17,261 |
| 2024 | $3,521 | $17,528 | $408 | $17,120 |
| 2023 | $3,321 | $16,537 | $391 | $16,146 |
| 2022 | $3,114 | $30,449 | $773 | $29,676 |
| 2021 | $3,098 | $27,479 | $773 | $26,706 |
| 2020 | $3,116 | $20,955 | $773 | $20,182 |
| 2019 | $3,056 | $18,242 | $773 | $17,469 |
| 2018 | $2,809 | $13,781 | $551 | $13,230 |
| 2017 | $2,650 | $13,001 | $531 | $12,470 |
| 2016 | $2,452 | $13,001 | $531 | $12,470 |
| 2015 | $1,479 | $12,266 | $500 | $11,766 |
| 2014 | $1,479 | $12,174 | $425 | $11,749 |
Source: Public Records
Map
Nearby Homes
- 9414 51st Ave
- 93-10 50th Ave
- 94-30 50th Ave
- 51-02 Junction Blvd
- 94-14 Corona Ave
- 94-28 53rd Ave
- 5214 92nd St
- 9052 52nd Ave
- 4808 92nd St
- 9421 Alstyne Ave Unit 2D
- 54-08 92nd St
- 9628 Corona Ave
- 91-02 50th Ave
- 91-23 Corona Ave Unit 6B
- 91-23 Corona Ave Unit 2A
- 91-23 Corona Ave Unit 5E
- 91-23 Corona Ave Unit 5A
- 91-23 Corona Ave Unit 6C
- 91-23 Corona Ave Unit 4A
- 91-23 Corona Ave Unit 2F
- 9246 52nd Ave Unit 3B
- 9246 52nd Ave Unit 3A
- 9246 52nd Ave Unit 2B
- 9246 52nd Ave Unit 2A
- 9246 52nd Ave
- 9248 52nd Ave Unit 3 Fl
- 9248 52nd Ave Unit 3
- 9248 52nd Ave
- 9248 52nd Ave Unit 3B
- 9248 52nd Ave Unit 3A
- 9248 52nd Ave Unit 2B
- 9248 52nd Ave Unit 2A
- 9248 52nd Ave Unit 1B
- 9248 52nd Ave Unit 2B
- 9248 52nd Ave Unit 3
- 9248 52nd Ave Unit 3
- 9246 52nd Ave Unit 3A
- 9246 52nd Ave Unit 1A/1B/
- 9246 52nd Ave Unit 2A
- 9246 52nd Ave