NOT LISTED FOR SALE

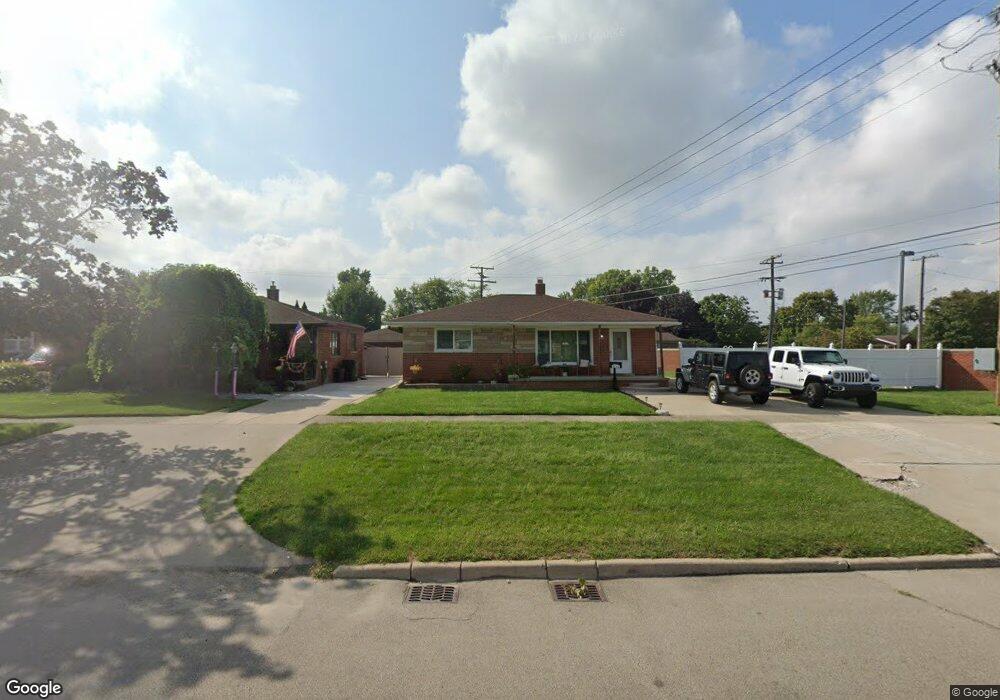
9246 Allen Rd Allen Park, MI 48101

Estimated Value: $209,000 - $263,000

3 Beds
2 Baths
952 Sq Ft
$247/Sq Ft Est. Value

About This Home

This home is located at 9246 Allen Rd, Allen Park, MI 48101 and is currently estimated at $234,858, approximately $246 per square foot. 9246 Allen Rd is a home located in Wayne County with nearby schools including Lindemann Elementary School, Allen Park Middle School, and Allen Park High School.

Ownership History

Date Name Owned For Owner Type

Purchase Details

Closed on
Apr 26, 2013
Sold by
Heartland Of Allen Park Mi Llc
Bought by
Madera Joseph K
Current Estimated Value
$234,858

Purchase Details

Closed on
Apr 24, 2009
Sold by
Secretary Of Housing & Urban Development
Bought by
Madera Joseph K

Home Financials for this Owner

Home Financials are based on the most recent Mortgage that was taken out on this home.
Original Mortgage
$55,148
Interest Rate
4.83%
Mortgage Type
FHA

Purchase Details

Closed on
Jan 14, 2009
Sold by
Chase Home Finance Llc
Bought by
The Secretary Of Housing & Urban Develop

Purchase Details

Closed on
Aug 20, 2008
Sold by
Czarnomski Matthew S and Czarnomski Jennifer
Bought by
Chase Home Finance Llc

Purchase Details

Closed on
Sep 26, 2003
Sold by
Verbeke Lena and Verbeke Lena W
Bought by
Czarnomski Matthew S

Range of Values:

Collateral Analytics

Collateral Analytics Collateral Analytics AVMs (Automated Valuation Model) employ a number of statistical approaches combined with neighborhood-specific comparable selection guarantees the most up-to-date and precise valuations.

Not Available

Collateral Analytics does not have data for the current month. Please view the chart for historical values.

ICE

ICE Mortgage Technology ICE Mortgage Technology’s AVM (Automated Valuation Model) is a state-of-the-art online residential property valuation tool that provides a quick and accurate estimate of the value of almost any home in the U.S.

Not Available

ICE Mortgage Technology does not have data for the current month. Please view the chart for historical values.

First American

First American First American Data & Analytics’ next-generation AVM combines unrivaled data assets with a blended ensemble of valuation models to produce highly accurate, reliable valuations you can trust.

Not Available

First American does not have data for the current month. Please view the chart for historical values.

Quantarium

Quantarium Quantarium’s valuation service, repeatedly proven the industry’s most accurate and comprehensive, is supercharged with a self-learning and auto-tuning AI engine that continually becomes smarter and more accurate as it processes daily inputs from the industry’s leading RE data lake.

Not Available

Quantarium does not have data for the current month. Please view the chart for historical values.

Average Value
Not Available
List Price
Sold Price
Create a Home Valuation Report for This Property
The Home Valuation Report is an in-depth analysis detailing your home's value as well as a comparison with similar homes in the area

Home Values in the Area

Source: Public Records

Average Home Value in this Area


Source: Public Records

Purchase History

Date Buyer Sale Price Title Company
Madera Joseph K -- None Available
Madera Joseph K $50,001 Metropolitan
The Secretary Of Housing & Urban Develop -- None Available
Chase Home Finance Llc $148,896 None Available
Czarnomski Matthew S $141,000 Minnesota Title Agency
Source: Public Records

Mortgage History

Date Status Borrower Loan Amount
Open Madera Joseph K $49,043
Previous Owner Madera Joseph K $55,148
Previous Owner Czarnomski Matthew S $10,000
Source: Public Records

Tax History Compared to Growth

Source: Public Records

Tax History

Year Tax Paid Tax Assessment Tax Assessment Total Assessment is a certain percentage of the fair market value that is determined by local assessors to be the total taxable value of land and additions on the property. Land Improvement
2024 $3,116 $109,600 $0 $0
2023 $2,977 $100,300 $0 $0
2022 $3,566 $89,400 $0 $0
2021 $3,468 $82,800 $0 $0
2020 $3,426 $77,200 $0 $0
2019 $3,400 $71,100 $0 $0
2018 $2,673 $59,900 $0 $0
2017 $1,308 $59,200 $0 $0
2016 $3,323 $59,900 $0 $0
2015 $5,243 $54,900 $0 $0
2013 $5,100 $52,000 $0 $0
2012 $2,688 $50,200 $13,700 $36,500
Source: Public Records

Map