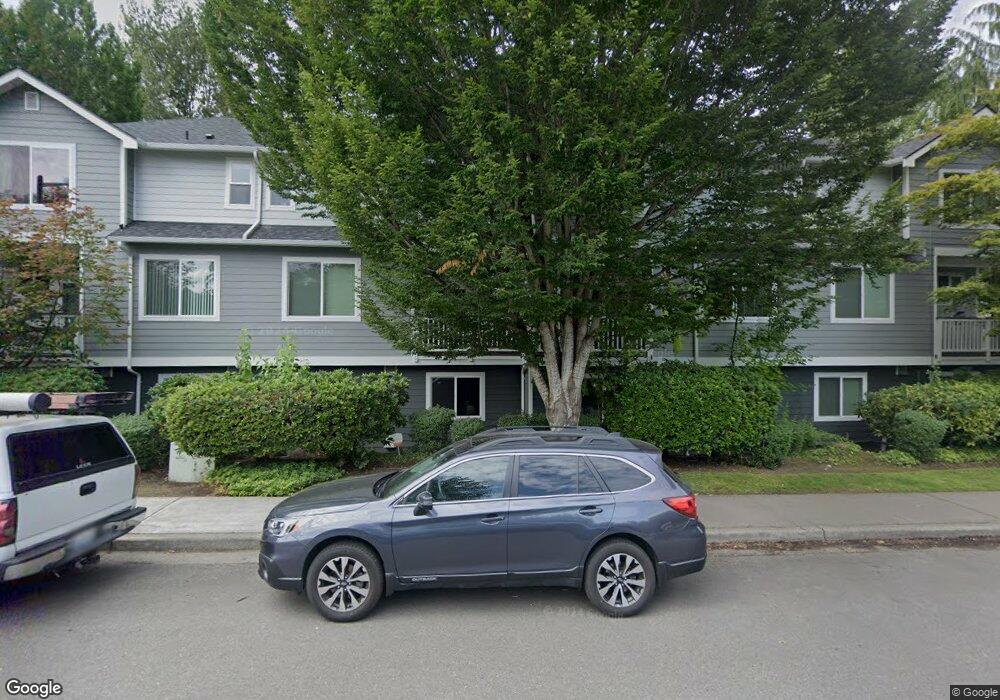
925 5th Ave NW Unit C110 Issaquah, WA 98027
Gilman NeighborhoodEstimated Value: $804,871 - $862,000
3
Beds
3
Baths
1,405
Sq Ft
$589/Sq Ft
Est. Value
About This Home
This home is located at 925 5th Ave NW Unit C110, Issaquah, WA 98027 and is currently estimated at $827,968, approximately $589 per square foot. 925 5th Ave NW Unit C110 is a home located in King County with nearby schools including Issaquah Valley Elementary School, Issaquah Middle School, and Issaquah High School.
Ownership History
Date
Name
Owned For
Owner Type
Purchase Details
Closed on
Oct 27, 2006
Sold by
Roberts Charles W
Bought by
Brown Maurice and Brown Hiromi
Current Estimated Value
Home Financials for this Owner
Home Financials are based on the most recent Mortgage that was taken out on this home.
Original Mortgage
$287,900
Outstanding Balance
$171,727
Interest Rate
6.36%
Estimated Equity
$656,241
Purchase Details
Closed on
Oct 3, 2002
Sold by
Lickteig Anthony W
Bought by
Roberts Charles W
Home Financials for this Owner
Home Financials are based on the most recent Mortgage that was taken out on this home.
Original Mortgage
$228,000
Interest Rate
6.25%
Purchase Details
Closed on
Aug 13, 1997
Sold by
Juniper 3 Ltd Partnership
Bought by
Lickteig Anthony W
Home Financials for this Owner
Home Financials are based on the most recent Mortgage that was taken out on this home.
Original Mortgage
$174,550
Interest Rate
7.61%
Create a Home Valuation Report for This Property
The Home Valuation Report is an in-depth analysis detailing your home's value as well as a comparison with similar homes in the area
Home Values in the Area
Average Home Value in this Area
Purchase History
| Date | Buyer | Sale Price | Title Company |
|---|---|---|---|
| Brown Maurice | $359,900 | The Talon Grou | |
| Roberts Charles W | $240,000 | First American Title Ins Co | |
| Lickteig Anthony W | $179,950 | Chicago Title Ins Co |
Source: Public Records
Mortgage History
| Date | Status | Borrower | Loan Amount |
|---|---|---|---|
| Open | Brown Maurice | $287,900 | |
| Previous Owner | Roberts Charles W | $228,000 | |
| Previous Owner | Lickteig Anthony W | $174,550 |
Source: Public Records
Tax History Compared to Growth
Tax History
| Year | Tax Paid | Tax Assessment Tax Assessment Total Assessment is a certain percentage of the fair market value that is determined by local assessors to be the total taxable value of land and additions on the property. | Land | Improvement |
|---|---|---|---|---|
| 2024 | $5,880 | $712,000 | $365,200 | $346,800 |
| 2023 | $4,901 | $695,000 | $267,800 | $427,200 |
| 2022 | $5,018 | $644,000 | $219,100 | $424,900 |
| 2021 | $4,999 | $541,000 | $219,100 | $321,900 |
| 2020 | $5,178 | $501,000 | $219,100 | $281,900 |
| 2018 | $4,520 | $500,000 | $158,200 | $341,800 |
| 2017 | $3,322 | $438,000 | $146,000 | $292,000 |
| 2016 | $3,170 | $334,000 | $146,000 | $188,000 |
| 2015 | $3,243 | $313,000 | $136,300 | $176,700 |
| 2014 | -- | $315,000 | $121,700 | $193,300 |
| 2013 | -- | $229,000 | $121,700 | $107,300 |
Source: Public Records
Map
Nearby Homes
- 810 5th Ave NW
- 695 NW Locust St (Homesite 9)
- 691 NW
- 693 NW Locust St (Homesite 10)
- 699 NW Locust St (Homesite 7)
- Towns On 7th Plan at Towns on 7th
- 750 3rd Ave NW
- 455 Newport Way NW Unit 302
- 961 NW Pickering St
- 280 Newport Way NW Unit B14
- 280 Newport Way NW Unit B-9
- 205 Newport Way NW Unit G2
- 170 NW Dogwood St
- 260 Newport Way NW Unit 23
- 190 XX SE 66th St
- 820 W Sunset Way
- 120 Newport Way NW Unit 17
- 200 Mountain Park Blvd SW Unit A103
- 200 Mt Park Blvd SW Unit A204
- 220 SW Clark St Unit B104
- 925 5th Ave NW Unit B109
- 925 5th Ave NW Unit D114
- 925 5th Ave NW Unit B106
- 925 5th Ave NW Unit A101
- 925 5th Ave NW Unit B103
- 925 5th Ave NW Unit B107
- 925 5th Ave NW Unit C111
- 925 5th Ave NW Unit C113
- 925 5th Ave NW Unit A102
- 925 5th Ave NW Unit C112
- 925 5th Ave NW Unit B108
- 925 5th Ave NW Unit D115
- 925 5th Ave NW Unit B105
- 925 5th Ave NW Unit B104
- 755 5th Ave NW
- 755 5th Ave NW Unit F102
- 755 5th Ave NW Unit A204
- 755 5th Ave NW Unit C103
- 755 5th Ave NW Unit C101
- 755 5th Ave NW Unit D102