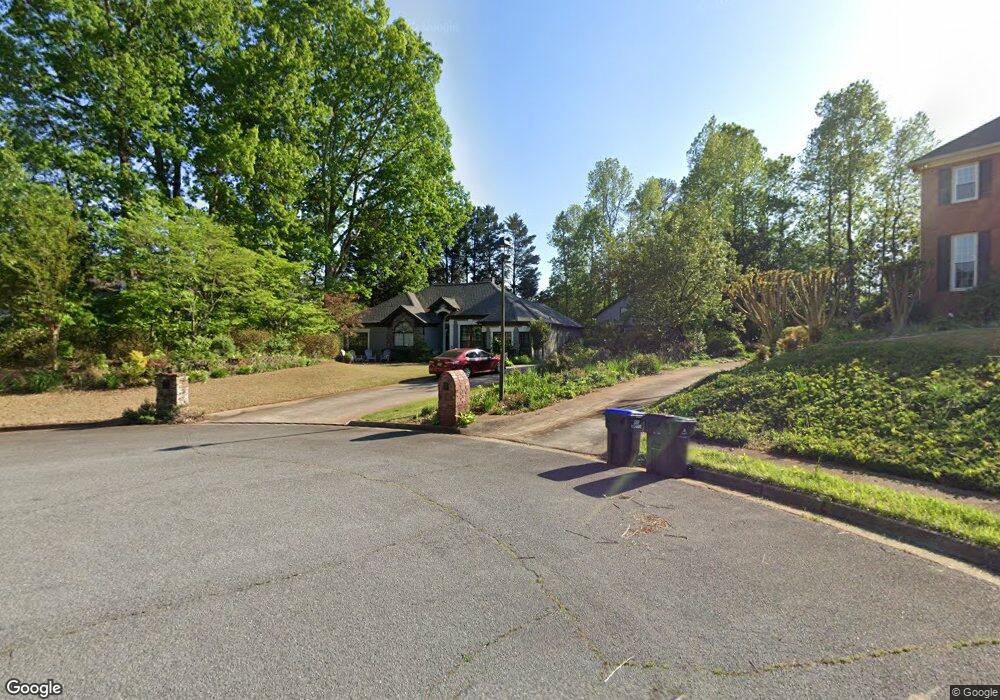
925 Allenbrook Ln Roswell, GA 30075
Estimated Value: $536,000 - $738,000
3
Beds
3
Baths
2,471
Sq Ft
$267/Sq Ft
Est. Value
About This Home
This home is located at 925 Allenbrook Ln, Roswell, GA 30075 and is currently estimated at $660,645, approximately $267 per square foot. 925 Allenbrook Ln is a home located in Fulton County with nearby schools including Roswell North Elementary School, Crabapple Middle School, and Fellowship Christian School.
Ownership History
Date
Name
Owned For
Owner Type
Purchase Details
Closed on
Apr 28, 2004
Sold by
Raju Katari S and Raju Kalpana
Bought by
Borim Justin
Current Estimated Value
Home Financials for this Owner
Home Financials are based on the most recent Mortgage that was taken out on this home.
Original Mortgage
$184,800
Outstanding Balance
$79,775
Interest Rate
4.38%
Mortgage Type
New Conventional
Estimated Equity
$580,870
Purchase Details
Closed on
Apr 25, 2003
Sold by
Raju Katris S and Raju Kalpana
Bought by
Raju Katari S and Raju Kalpana
Home Financials for this Owner
Home Financials are based on the most recent Mortgage that was taken out on this home.
Original Mortgage
$183,000
Interest Rate
5.79%
Mortgage Type
New Conventional
Purchase Details
Closed on
Mar 9, 2000
Sold by
Lightstone Alan and Lightstone Sharon P
Bought by
Raju Katri S and Raju Kalpana
Home Financials for this Owner
Home Financials are based on the most recent Mortgage that was taken out on this home.
Original Mortgage
$165,600
Interest Rate
8.38%
Mortgage Type
New Conventional
Create a Home Valuation Report for This Property
The Home Valuation Report is an in-depth analysis detailing your home's value as well as a comparison with similar homes in the area
Home Values in the Area
Average Home Value in this Area
Purchase History
| Date | Buyer | Sale Price | Title Company |
|---|---|---|---|
| Borim Justin | $231,000 | -- | |
| Raju Katari S | -- | -- | |
| Raju Katri S | $207,000 | -- |
Source: Public Records
Mortgage History
| Date | Status | Borrower | Loan Amount |
|---|---|---|---|
| Open | Borim Justin | $184,800 | |
| Previous Owner | Raju Katari S | $183,000 | |
| Previous Owner | Raju Katri S | $165,600 |
Source: Public Records
Tax History Compared to Growth
Tax History
| Year | Tax Paid | Tax Assessment Tax Assessment Total Assessment is a certain percentage of the fair market value that is determined by local assessors to be the total taxable value of land and additions on the property. | Land | Improvement |
|---|---|---|---|---|
| 2025 | $821 | $230,480 | $63,360 | $167,120 |
| 2023 | $6,122 | $216,880 | $67,400 | $149,480 |
| 2022 | $3,377 | $186,640 | $43,960 | $142,680 |
| 2021 | $3,998 | $146,600 | $20,840 | $125,760 |
| 2020 | $4,059 | $154,280 | $20,800 | $133,480 |
| 2019 | $654 | $151,560 | $20,440 | $131,120 |
| 2018 | $3,645 | $148,000 | $19,960 | $128,040 |
| 2017 | $3,315 | $125,560 | $26,040 | $99,520 |
| 2016 | $3,208 | $125,560 | $26,040 | $99,520 |
| 2015 | $3,904 | $125,560 | $26,040 | $99,520 |
| 2014 | $2,786 | $103,640 | $21,480 | $82,160 |
Source: Public Records
Map
Nearby Homes
- 10908 Woodstock Rd
- 210 Devereux Downs
- 130 Elizabeth Cove
- 5000 Lexington Dr
- 1002 Towneship Way
- 1000 Sterling Ct
- 1012 Towneship Way
- 515 Wavetree Dr
- 6010 Claiborne Cove
- 115 Great Oaks Ln
- 220 Wind Shadow Ct
- 110 Great Oaks Ln
- 178 Victoria Way
- 5022 Towneship Creek Rd
- 120 Gala Ct
- 310 Bloomfield Ct
- 1515 Elgaen Place Dr
- 10875 Shallowford Rd
- 935 Allenbrook Ln
- 420 Allenbrook Ct
- 410 Allenbrook Ct
- 400 Allenbrook Ct
- 930 Allenbrook Ln
- 430 Allenbrook Ct
- 960 Allenbrook Ln
- 950 Allenbrook Ln
- 940 Allenbrook Ln
- 440 Allenbrook Ct
- 415 Allenbrook Ct Unit 27
- 415 Allenbrook Ct
- 970 Allenbrook Ln
- 405 Allenbrook Ct
- 435 Allenbrook Ct
- 425 Allenbrook Ct
- 980 Allenbrook Ln
- 11170 Crosshaven Dr Unit 1
- 11160 Crosshaven Dr Unit 1
- 11160 Crosshaven Dr Unit 11160