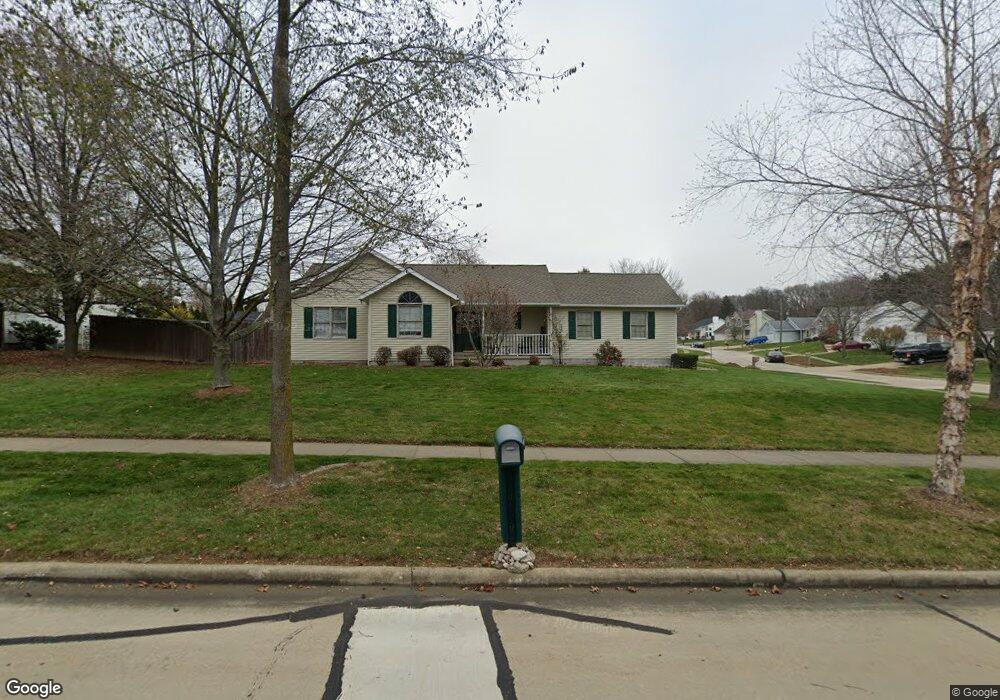
925 Brooke Way Wooster, OH 44691
Estimated Value: $247,570 - $259,000
3
Beds
2
Baths
1,112
Sq Ft
$226/Sq Ft
Est. Value
About This Home
This home is located at 925 Brooke Way, Wooster, OH 44691 and is currently estimated at $250,893, approximately $225 per square foot. 925 Brooke Way is a home located in Wayne County with nearby schools including Parkview Elementary School, Edgewood Middle School, and Wooster High School.
Ownership History
Date
Name
Owned For
Owner Type
Purchase Details
Closed on
Jun 9, 2000
Sold by
Towers John
Bought by
Opatz Jarred and Opatz Jamie
Current Estimated Value
Home Financials for this Owner
Home Financials are based on the most recent Mortgage that was taken out on this home.
Original Mortgage
$118,000
Outstanding Balance
$41,362
Interest Rate
8.14%
Mortgage Type
New Conventional
Estimated Equity
$209,531
Purchase Details
Closed on
Aug 14, 1998
Sold by
Cendel Group Ltd
Bought by
Burnett John T and Burnett Elizabeth A
Home Financials for this Owner
Home Financials are based on the most recent Mortgage that was taken out on this home.
Original Mortgage
$113,000
Interest Rate
5.88%
Mortgage Type
New Conventional
Purchase Details
Closed on
May 14, 1996
Sold by
Cendel Group Ltd
Bought by
Chanay Blaine E and Chanay Kimberly
Home Financials for this Owner
Home Financials are based on the most recent Mortgage that was taken out on this home.
Original Mortgage
$106,900
Interest Rate
7.78%
Mortgage Type
New Conventional
Create a Home Valuation Report for This Property
The Home Valuation Report is an in-depth analysis detailing your home's value as well as a comparison with similar homes in the area
Home Values in the Area
Average Home Value in this Area
Purchase History
| Date | Buyer | Sale Price | Title Company |
|---|---|---|---|
| Opatz Jarred | $124,250 | -- | |
| Burnett John T | $119,000 | -- | |
| Chanay Blaine E | $17,000 | -- |
Source: Public Records
Mortgage History
| Date | Status | Borrower | Loan Amount |
|---|---|---|---|
| Open | Opatz Jarred | $118,000 | |
| Previous Owner | Burnett John T | $113,000 | |
| Previous Owner | Chanay Blaine E | $106,900 |
Source: Public Records
Tax History Compared to Growth
Tax History
| Year | Tax Paid | Tax Assessment Tax Assessment Total Assessment is a certain percentage of the fair market value that is determined by local assessors to be the total taxable value of land and additions on the property. | Land | Improvement |
|---|---|---|---|---|
| 2024 | $2,774 | $66,880 | $11,800 | $55,080 |
| 2023 | $2,774 | $66,880 | $11,800 | $55,080 |
| 2022 | $2,544 | $48,810 | $8,610 | $40,200 |
| 2021 | $2,624 | $48,810 | $8,610 | $40,200 |
| 2020 | $2,488 | $48,810 | $8,610 | $40,200 |
| 2019 | $2,382 | $44,890 | $8,800 | $36,090 |
| 2018 | $2,389 | $44,890 | $8,800 | $36,090 |
| 2017 | $2,375 | $44,890 | $8,800 | $36,090 |
| 2016 | $2,481 | $43,170 | $8,800 | $34,370 |
| 2015 | $2,436 | $43,170 | $8,800 | $34,370 |
| 2014 | $2,437 | $43,170 | $8,800 | $34,370 |
| 2013 | $2,457 | $43,030 | $8,820 | $34,210 |
Source: Public Records
Map
Nearby Homes
- 2194 Ryan Ct
- 941 Woodmere Dr
- 1100 Nelson Ave
- 1951 Saddle Brook Cir Unit 1951
- 1960 Autumn Run
- 2360 Star Dr
- 2447 Wetherington Ln
- 2447 Wetherington Ln Unit 130
- 2447 Wetherington Ln Unit 129
- 2117 Canterbury Ln
- 2143 Canterbury Ln
- 629 Meadow Ln
- 577 Memory Ln
- 596 Meadow Ln
- 2457 Barrington Way Unit 325
- 2457 Barrington Way Unit 327
- 2457 Barrington Way Unit 334
- 2520 Barrington Way Unit 529
- 1694 Arthur Dr
- 536 Catalina Blvd
- 2092 Melanie Dr
- 951 Brooke Way
- 2199 Normandy Dr
- 930 Brooke Way
- 2099 Melanie Dr
- 971 Brooke Way
- 910 Brooke Way
- 2177 Normandy Dr
- 877 Brooke Way
- 950 Brooke Way
- 2161 Normandy Dr
- 890 Brooke Way
- 970 Brooke Way
- 991 Brooke Way
- 2119 Melanie Dr
- 2145 Normandy Dr
- 865 Brooke Way
- 2140 Melanie Dr
- 925 Patrick Place
- 990 Brooke Way