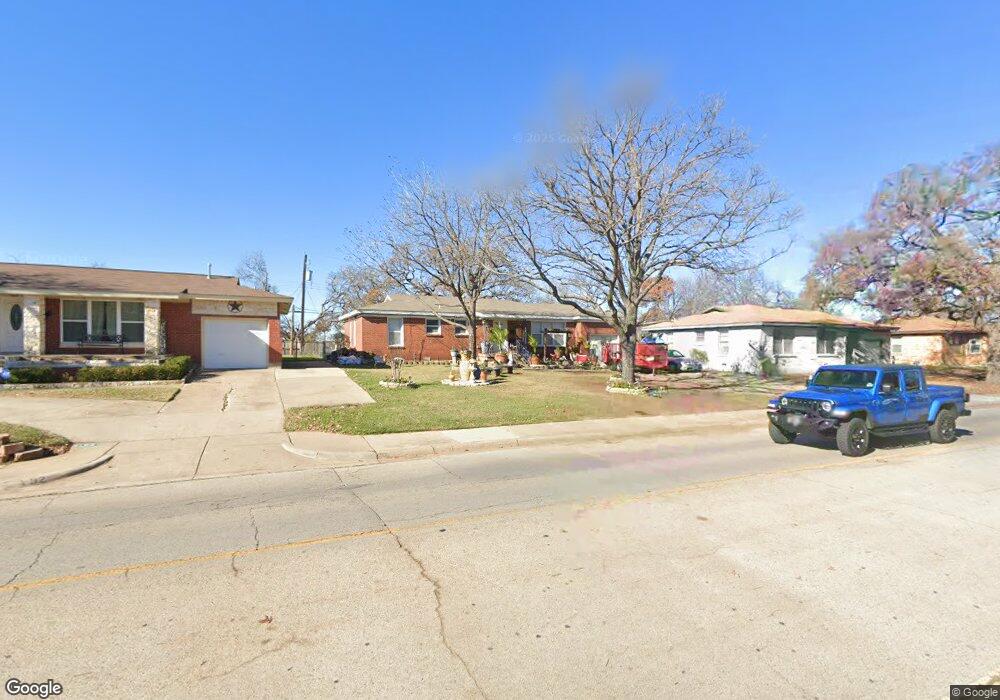
925 Brown Trail Bedford, TX 76022
Estimated Value: $197,000 - $237,084
3
Beds
1
Bath
1,112
Sq Ft
$201/Sq Ft
Est. Value
About This Home
This home is located at 925 Brown Trail, Bedford, TX 76022 and is currently estimated at $223,021, approximately $200 per square foot. 925 Brown Trail is a home located in Tarrant County with nearby schools including Harrison Lane Elementary School, Hurst J High School, and L.D. Bell High School.
Ownership History
Date
Name
Owned For
Owner Type
Purchase Details
Closed on
Jul 28, 2023
Sold by
Rocha Jennifer Jazmin De La Garza
Bought by
Jdgr Properties Llc
Current Estimated Value
Purchase Details
Closed on
Sep 1, 2015
Sold by
Sepulveda Eliseo Ruben and Sepulveda George William
Bought by
Dela Garza Jennifer
Purchase Details
Closed on
Dec 26, 2007
Sold by
Adams Erinn N
Bought by
Sepulveda Eliseo Ruben and Sepulveda George William
Purchase Details
Closed on
Nov 21, 2002
Sold by
Kirby Melvin Lee and Sanders Cristin L
Bought by
Adams Erinn N
Home Financials for this Owner
Home Financials are based on the most recent Mortgage that was taken out on this home.
Original Mortgage
$76,396
Interest Rate
6.28%
Mortgage Type
FHA
Purchase Details
Closed on
Dec 21, 2000
Sold by
Kirby Melvin L and Kirby Gover Lee
Bought by
Kirby Melvin L and Melvin L Kirby Revocable Living Trust
Create a Home Valuation Report for This Property
The Home Valuation Report is an in-depth analysis detailing your home's value as well as a comparison with similar homes in the area
Home Values in the Area
Average Home Value in this Area
Purchase History
| Date | Buyer | Sale Price | Title Company |
|---|---|---|---|
| Jdgr Properties Llc | -- | None Listed On Document | |
| Dela Garza Jennifer | -- | None Available | |
| Dela Garza Jennifer | -- | None Available | |
| Sepulveda Eliseo Ruben | -- | None Available | |
| Adams Erinn N | -- | Alamo Title Company | |
| Kirby Melvin L | -- | -- |
Source: Public Records
Mortgage History
| Date | Status | Borrower | Loan Amount |
|---|---|---|---|
| Previous Owner | Adams Erinn N | $76,396 |
Source: Public Records
Tax History Compared to Growth
Tax History
| Year | Tax Paid | Tax Assessment Tax Assessment Total Assessment is a certain percentage of the fair market value that is determined by local assessors to be the total taxable value of land and additions on the property. | Land | Improvement |
|---|---|---|---|---|
| 2025 | $4,368 | $205,000 | $55,000 | $150,000 |
| 2024 | $4,368 | $224,372 | $55,000 | $169,372 |
| 2023 | $3,939 | $205,378 | $35,000 | $170,378 |
| 2022 | $3,883 | $177,791 | $35,000 | $142,791 |
| 2021 | $4,072 | $172,865 | $35,000 | $137,865 |
| 2020 | $3,312 | $139,294 | $35,000 | $104,294 |
| 2019 | $3,478 | $143,153 | $35,000 | $108,153 |
| 2018 | $2,940 | $121,005 | $16,000 | $105,005 |
| 2017 | $2,923 | $120,839 | $16,000 | $104,839 |
| 2016 | $2,398 | $99,112 | $16,000 | $83,112 |
| 2015 | $1,808 | $72,000 | $15,000 | $57,000 |
| 2014 | $1,808 | $72,000 | $15,000 | $57,000 |
Source: Public Records
Map
Nearby Homes
- 929 Brown Trail
- 921 Brown Trail
- 924 Walter St
- 933 Brown Trail
- 917 Brown Trail
- 928 Walter St
- 920 Walter St
- 936 Brown Trail
- 932 Brown Trail
- 916 Walter St
- 937 Brown Trail
- 913 Brown Trail
- 928 Brown Trail
- 936 Walter St
- 912 Walter St
- 301 Bedford Ct E
- 924 Brown Trail
- 941 Brown Trail
- 909 Brown Trail
- 933 Glenda Dr