Estimated Value: $377,000 - $413,281
3
Beds
1
Bath
1,656
Sq Ft
$239/Sq Ft
Est. Value
About This Home
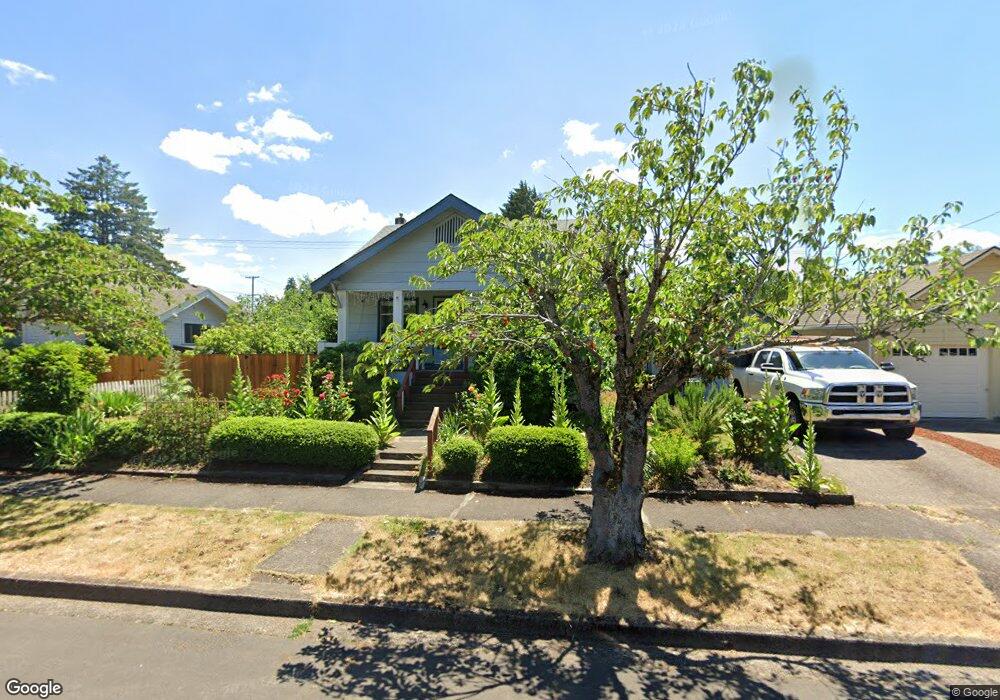
This home is located at 925 C St, Springfield, OR 97477 and is currently estimated at $395,070, approximately $238 per square foot. 925 C St is a home located in Lane County with nearby schools including Two Rivers Dos Rios Elementary School, Hamlin Middle School, and Springfield High School.
Ownership History
Date
Name
Owned For
Owner Type
Purchase Details
Closed on
Oct 7, 2016
Sold by
Lauritsen Virginia
Bought by
Hicks Roger J and Vinyeta Kirsten R
Current Estimated Value
Home Financials for this Owner
Home Financials are based on the most recent Mortgage that was taken out on this home.
Original Mortgage
$206,196
Outstanding Balance
$163,288
Interest Rate
3.25%
Mortgage Type
FHA
Estimated Equity
$231,782
Purchase Details
Closed on
Aug 12, 2016
Sold by
Ballew Anne and Lauritsen Virginia
Bought by
Lauritsen Virginia
Home Financials for this Owner
Home Financials are based on the most recent Mortgage that was taken out on this home.
Original Mortgage
$206,196
Outstanding Balance
$163,288
Interest Rate
3.25%
Mortgage Type
FHA
Estimated Equity
$231,782
Purchase Details
Closed on
Jan 22, 2016
Sold by
Nelson Darrol L
Bought by
Nelson Darrol L and Nelson Ellen
Purchase Details
Closed on
Jan 20, 2005
Sold by
Ballew Anne
Bought by
Ballew Anne and Lauritsen Virginia
Create a Home Valuation Report for This Property
The Home Valuation Report is an in-depth analysis detailing your home's value as well as a comparison with similar homes in the area
Home Values in the Area
Average Home Value in this Area
Purchase History
| Date | Buyer | Sale Price | Title Company |
|---|---|---|---|
| Hicks Roger J | $210,000 | Evergreen Land Title Co | |
| Lauritsen Virginia | -- | Evergreen Land Title Co | |
| Nelson Darrol L | -- | None Available | |
| Ballew Anne | -- | -- |
Source: Public Records
Mortgage History
| Date | Status | Borrower | Loan Amount |
|---|---|---|---|
| Open | Hicks Roger J | $206,196 |
Source: Public Records
Tax History
| Year | Tax Paid | Tax Assessment Tax Assessment Total Assessment is a certain percentage of the fair market value that is determined by local assessors to be the total taxable value of land and additions on the property. | Land | Improvement |
|---|---|---|---|---|
| 2025 | $3,056 | $166,670 | -- | -- |
| 2024 | $3,007 | $161,816 | -- | -- |
| 2023 | $3,007 | $157,103 | $0 | $0 |
| 2022 | $2,785 | $152,528 | $0 | $0 |
| 2021 | $2,735 | $148,086 | $0 | $0 |
| 2020 | $2,655 | $143,773 | $0 | $0 |
| 2019 | $2,575 | $139,586 | $0 | $0 |
| 2018 | $2,427 | $131,574 | $0 | $0 |
| 2017 | $2,334 | $131,574 | $0 | $0 |
| 2016 | $2,285 | $127,742 | $0 | $0 |
| 2015 | $2,220 | $124,021 | $0 | $0 |
| 2014 | $2,187 | $120,409 | $0 | $0 |
Source: Public Records
Map
Nearby Homes
Your Personal Tour Guide
Ask me questions while you tour the home.