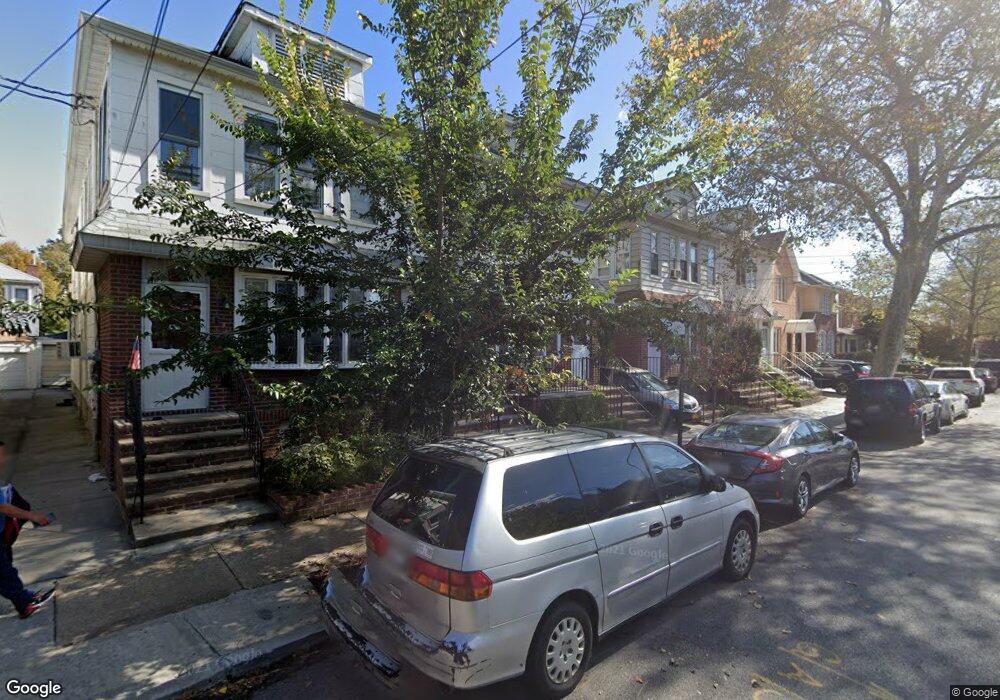
925 E 28th St Brooklyn, NY 11210
Midwood NeighborhoodEstimated Value: $1,218,000 - $1,767,908
Studio
--
Bath
2,560
Sq Ft
$545/Sq Ft
Est. Value
About This Home
This home is located at 925 E 28th St, Brooklyn, NY 11210 and is currently estimated at $1,396,227, approximately $545 per square foot. 925 E 28th St is a home located in Kings County with nearby schools including P.S. 193 Gil Hodges, Andries Hudde School, and Masores Bais Yaakov.
Ownership History
Date
Name
Owned For
Owner Type
Purchase Details
Closed on
Jul 14, 2023
Sold by
Pitterman Dovid and Pitterman Hindy
Bought by
Chaim T Pitterman As Trustee and Pitterman Family Irrevocable Trust
Current Estimated Value
Purchase Details
Closed on
May 23, 2018
Sold by
Taub David and Taub Ester
Bought by
Pitterman David and Pitterman Elchonon
Home Financials for this Owner
Home Financials are based on the most recent Mortgage that was taken out on this home.
Original Mortgage
$650,000
Interest Rate
4.4%
Mortgage Type
New Conventional
Purchase Details
Closed on
Jan 10, 1999
Sold by
Taub Menhard and Taub Ester
Bought by
Taub Ester and Taub David
Purchase Details
Closed on
Dec 22, 1998
Sold by
Nappi John and Nappi Albert
Bought by
Nappi John
Create a Home Valuation Report for This Property
The Home Valuation Report is an in-depth analysis detailing your home's value as well as a comparison with similar homes in the area
Home Values in the Area
Average Home Value in this Area
Purchase History
| Date | Buyer | Sale Price | Title Company |
|---|---|---|---|
| Chaim T Pitterman As Trustee | -- | -- | |
| Chaim T Pitterman As Trustee | -- | -- | |
| Chaim T Pitterman As Trustee | -- | -- | |
| Pitterman David | $975,000 | -- | |
| Pitterman David | $975,000 | -- | |
| Pitterman David | $975,000 | -- | |
| Taub Ester | -- | Stewart Title Insurance Co | |
| Taub Ester | -- | Stewart Title Insurance Co | |
| Nappi John | $75,000 | -- | |
| Nappi John | -- | -- |
Source: Public Records
Mortgage History
| Date | Status | Borrower | Loan Amount |
|---|---|---|---|
| Previous Owner | Pitterman David | $650,000 |
Source: Public Records
Tax History
| Year | Tax Paid | Tax Assessment Tax Assessment Total Assessment is a certain percentage of the fair market value that is determined by local assessors to be the total taxable value of land and additions on the property. | Land | Improvement |
|---|---|---|---|---|
| 2025 | $9,139 | $77,940 | $22,740 | $55,200 |
| 2024 | $9,139 | $67,260 | $22,740 | $44,520 |
| 2023 | $8,911 | $64,440 | $22,740 | $41,700 |
| 2022 | $8,240 | $66,780 | $22,740 | $44,040 |
| 2021 | $8,185 | $72,540 | $22,740 | $49,800 |
| 2019 | $7,640 | $77,160 | $22,740 | $54,420 |
| 2018 | $7,394 | $37,731 | $14,834 | $22,897 |
| 2017 | $6,957 | $35,596 | $16,372 | $19,224 |
| 2016 | $6,404 | $33,583 | $14,956 | $18,627 |
| 2015 | $3,830 | $31,683 | $16,467 | $15,216 |
| 2014 | $3,830 | $31,600 | $16,323 | $15,277 |
Source: Public Records
Map
Nearby Homes
- 927 E 27th St
- 909 E 29th St Unit 2-K
- 909 E 29th St Unit 3F
- 909 E 29th St Unit 3D
- 928 E 26th St
- 1006 E 31st St
- 3108 Avenue I
- 1024 E 31st St
- 3098 Bedford Ave
- 2415 Avenue J
- 945 E 32nd St
- 973 E 32nd St
- 1804 New York Ave
- 1046 E 32nd St
- 1533 - 1535 New York Ave
- 1708 Flatbush Ave
- 3402 Avenue J
- 2202 Avenue I
- 1117 E 31st St
- 1742 Flatbush Ave
- 929 E 28th St
- 923 E 28th St
- 931 E 28th St
- 919 E 28th St
- 917 E 28th St
- 935 E 28th St
- 935 E 28th St Unit Building
- 913 E 28th St
- 937 E 28th St
- 937 E 28th St Unit Building
- 924 E 29 St
- 926 E 29 St
- 926 E 29th St
- 924 E 29th St
- 930 E 29th St
- 926 E 29 St
- 920 E 29th St
- 932 E 29th St
- 918 E 29th St
- 936 E 29th St
Your Personal Tour Guide
Ask me questions while you tour the home.