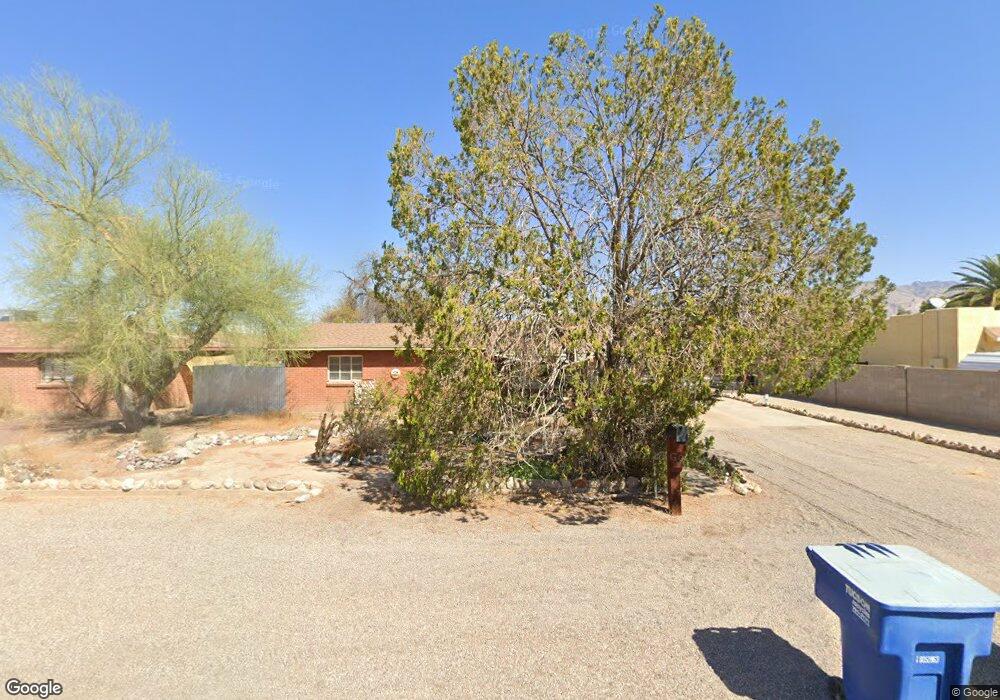
925 E King St Tucson, AZ 85719
Campus Farm NeighborhoodEstimated Value: $208,996 - $307,000
About This Home
This home is located at 925 E King St, Tucson, AZ 85719 and is currently estimated at $274,249, approximately $221 per square foot. 925 E King St is a home located in Pima County with nearby schools including Frances Owen Holaway Elementary School, Amphitheater Middle School, and Amphitheater High School.
Ownership History
We collect this data history from publicly available records. To have your information removed, we recommend requesting removal directly through your county’s website.
Purchase Details
Home Financials for this Owner
Home Financials are based on the most recent Mortgage that was taken out on this home.Purchase Details
Purchase Details
Home Financials for this Owner
Home Financials are based on the most recent Mortgage that was taken out on this home.Home Values in the Area
Average Home Value in this Area
Purchase History
We collect this data history from publicly available records. To have your information removed, we recommend requesting removal directly through your county’s website.
| Date | Buyer | Sale Price | Title Company |
|---|---|---|---|
| -- | Catal | ||
| -- | -- | ||
| -- | -- | ||
| -- | -- | ||
| -- | -- |
Mortgage History
We collect this data history from publicly available records. To have your information removed, we recommend requesting removal directly through your county’s website.
| Date | Status | Borrower | Loan Amount |
|---|---|---|---|
| Closed | $82,000 | ||
| Previous Owner | $53,429 |
Tax History
We collect this data history from publicly available records. To have your information removed, we recommend requesting removal directly through your county’s website.
| Year | Tax Paid | Tax Assessment Tax Assessment Total Assessment is a certain percentage of the fair market value that is determined by local assessors to be the total taxable value of land and additions on the property. | Land | Improvement |
|---|---|---|---|---|
| 2026 | $1,665 | $16,271 | -- | -- |
| 2025 | $1,665 | $15,496 | -- | -- |
| 2024 | $1,602 | $14,758 | -- | -- |
| 2023 | $1,548 | $14,055 | $0 | $0 |
| 2022 | $1,534 | $13,386 | $0 | $0 |
| 2021 | $1,513 | $12,142 | $0 | $0 |
| 2020 | $1,505 | $12,142 | $0 | $0 |
| 2019 | $1,465 | $12,395 | $0 | $0 |
| 2018 | $1,413 | $10,488 | $0 | $0 |
| 2017 | $1,389 | $10,488 | $0 | $0 |
| 2016 | $1,377 | $10,507 | $0 | $0 |
| 2015 | $1,342 | $10,007 | $0 | $0 |
Map
- 3701 N Park Ave
- 908 E Pastime Rd
- 945 E Prince Rd
- 905 E Prince Rd
- 806 E Joan Place
- 3825 N Tyndall Ave
- 1172 E Allen Rd
- 933 E Mesquite Dr
- 905 E Mesquite Dr Unit 2
- 1125 E Kleindale Rd
- 1114 E Descent St
- 1009 E Halcyon Rd
- 1502 E Painted Colt Loop
- 842 E Freeman Place
- 1527 E Prince Rd
- 4040 N Weimer Place Unit 4
- 1585 E Prince Rd
- 4156 N Fortune Loop
- 1110 E Halcyon Rd
- 3309 N Tyndall Ave
- 3709 N Park Ave
- 935 E King St
- 3719 N Park Ave
- 944 E King St
- 938 E King St
- 932 E King St
- 3674 N Park Ave
- 3731 N Park Ave
- 1008 E King St
- 3622 N Park Ave
- 926 E King St
- 926 E Ellis St
- 917 E King St
- 3728 N Park Ave
- 920 E King St
- 1014 E King St
- 918 E Ellis St
- 1007 E King St
- 1021 E Gifford Dr
- 909 E King St
Ask me questions while you tour the home.