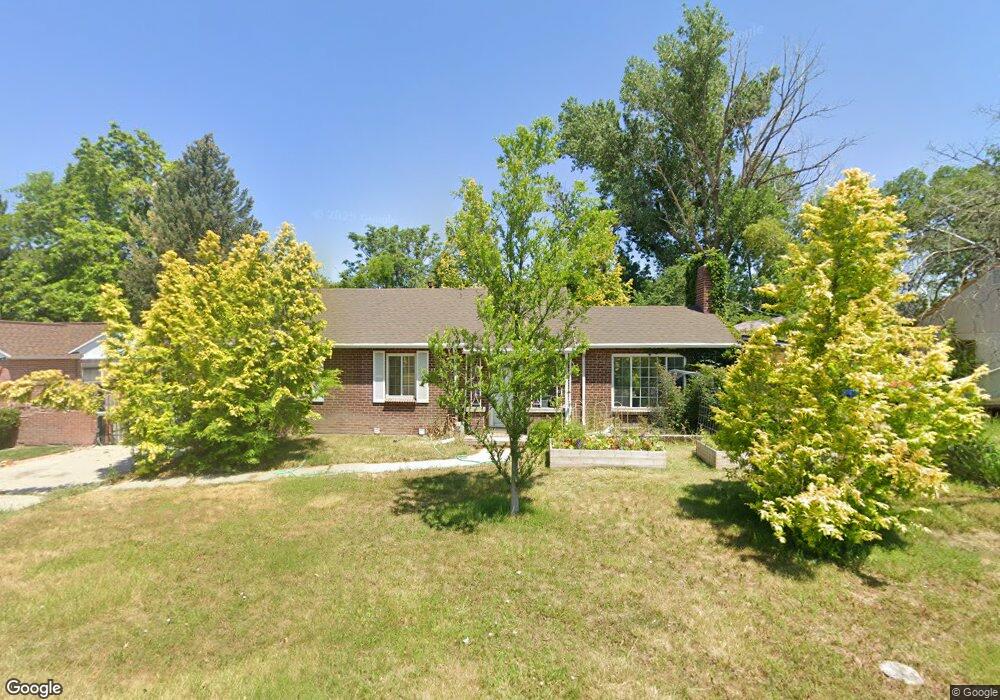
925 E Millcreek Way Salt Lake City, UT 84106
Estimated Value: $572,000 - $695,000
3
Beds
2
Baths
2,050
Sq Ft
$309/Sq Ft
Est. Value
About This Home
This home is located at 925 E Millcreek Way, Salt Lake City, UT 84106 and is currently estimated at $632,979, approximately $308 per square foot. 925 E Millcreek Way is a home located in Salt Lake County with nearby schools including Millcreek Elementary School, Lincoln Elementary, and Evergreen Junior High School.
Ownership History
Date
Name
Owned For
Owner Type
Purchase Details
Closed on
Sep 12, 2022
Sold by
Bluesky Trust
Bought by
Gibbs Joseph E and Gibbs Christine E
Current Estimated Value
Home Financials for this Owner
Home Financials are based on the most recent Mortgage that was taken out on this home.
Original Mortgage
$549,000
Outstanding Balance
$524,379
Interest Rate
5.22%
Mortgage Type
New Conventional
Estimated Equity
$108,600
Purchase Details
Closed on
Nov 2, 2007
Sold by
Stroud Robert
Bought by
Stroud Robert L
Purchase Details
Closed on
May 31, 2002
Sold by
Ortiz Victor and Ortiz Sherry E
Bought by
Stroud Robert
Home Financials for this Owner
Home Financials are based on the most recent Mortgage that was taken out on this home.
Original Mortgage
$203,700
Interest Rate
6.83%
Create a Home Valuation Report for This Property
The Home Valuation Report is an in-depth analysis detailing your home's value as well as a comparison with similar homes in the area
Home Values in the Area
Average Home Value in this Area
Purchase History
| Date | Buyer | Sale Price | Title Company |
|---|---|---|---|
| Gibbs Joseph E | -- | Title One Title | |
| Stroud Robert L | -- | None Available | |
| Stroud Robert | -- | Superior Title Company |
Source: Public Records
Mortgage History
| Date | Status | Borrower | Loan Amount |
|---|---|---|---|
| Open | Gibbs Joseph E | $549,000 | |
| Previous Owner | Stroud Robert | $203,700 |
Source: Public Records
Tax History Compared to Growth
Tax History
| Year | Tax Paid | Tax Assessment Tax Assessment Total Assessment is a certain percentage of the fair market value that is determined by local assessors to be the total taxable value of land and additions on the property. | Land | Improvement |
|---|---|---|---|---|
| 2025 | $3,137 | $529,600 | $246,100 | $283,500 |
| 2024 | $3,137 | $502,200 | $238,400 | $263,800 |
| 2023 | $3,137 | $469,100 | $180,100 | $289,000 |
| 2022 | $2,658 | $413,000 | $176,600 | $236,400 |
| 2021 | $2,551 | $343,600 | $176,600 | $167,000 |
| 2020 | $2,544 | $323,400 | $157,800 | $165,600 |
| 2019 | $2,246 | $278,900 | $144,500 | $134,400 |
| 2018 | $2,002 | $239,400 | $144,500 | $94,900 |
| 2017 | $1,748 | $219,000 | $144,500 | $74,500 |
| 2016 | $1,530 | $193,500 | $144,500 | $49,000 |
| 2015 | $1,942 | $229,900 | $173,700 | $56,200 |
| 2014 | $1,893 | $219,200 | $170,300 | $48,900 |
Source: Public Records
Map
Nearby Homes
- 956 E Best Ave
- 964 E 3385 S
- 3532 S 900 E
- 3379 S 900 E
- 3431 Brookview Ln
- 788 E Scott Ave Unit 5A
- 751 E Scott Ave
- 3602 S 805 E Unit 227
- 3592 S 805 E Unit 209
- 3578 S 805 E Unit 237
- 3580 S 805 St E Unit 229
- 3580 S 805 St E Unit 231
- 3610 S 805 St E Unit 233
- 3674 S 860 E Unit 46
- 3669 S 860 E Unit 29
- 3663 Redmaple Rd
- 1174 E 3300 S Unit 417
- 3346 S 700 E
- 833 E Whitemaple Way
- 841 Whitemaple Way Unit 843
- 925 Millcreek Way
- 935 Millcreek Way
- 935 E Millcreek Way
- 917 Millcreek Way
- 926 Michael Mill Place
- 941 Millcreek Way
- 926 E Michael Mills Place
- 934 Michael Mill Place
- 926 Michael Mills Place
- 934 Michael Mills Place
- 918 Michael Mill Place
- 909 E Millcreek Way
- 918 E Michael Mills Place
- 909 Millcreek Way
- 918 Michael Mills Place
- 928 Millcreek Way
- 942 Michael Mills Place
- 920 E Millcreek Way
- 932 Millcreek Way
- 932 E Millcreek Way