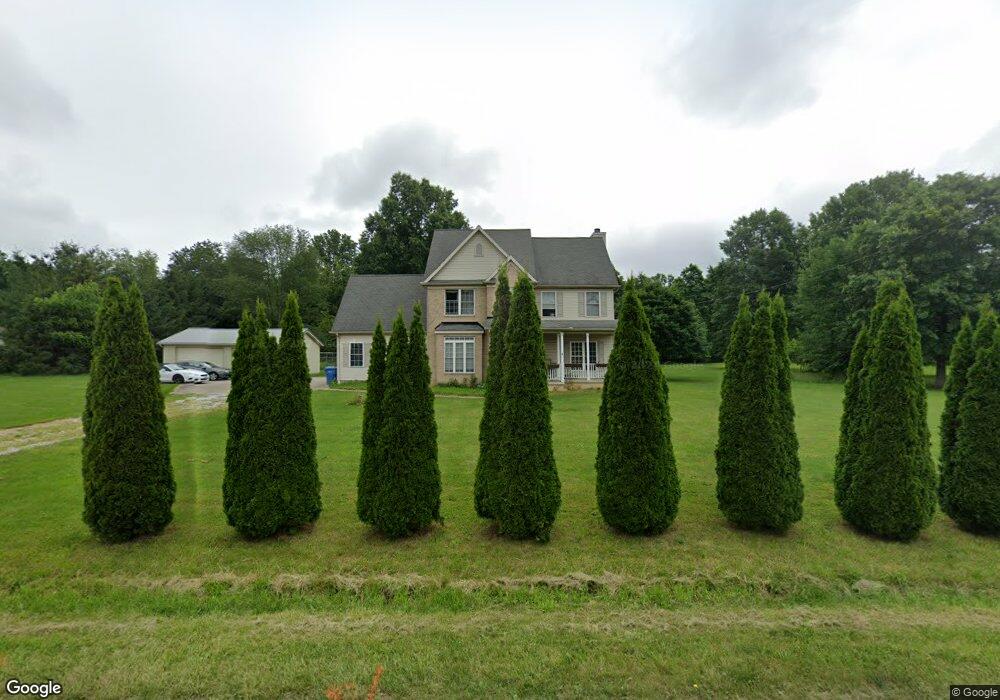
925 Harring Rd Uniontown, OH 44685
Estimated Value: $454,000 - $513,000
4
Beds
3
Baths
2,358
Sq Ft
$205/Sq Ft
Est. Value
About This Home
This home is located at 925 Harring Rd, Uniontown, OH 44685 and is currently estimated at $484,424, approximately $205 per square foot. 925 Harring Rd is a home located in Summit County with nearby schools including Greenwood Elementary School, Green Intermediate Elementary School, and Green Primary School.
Ownership History
Date
Name
Owned For
Owner Type
Purchase Details
Closed on
Jul 16, 2008
Sold by
Shaffer Adam L and Shaffer Dawn M
Bought by
Goshe Jill
Current Estimated Value
Home Financials for this Owner
Home Financials are based on the most recent Mortgage that was taken out on this home.
Original Mortgage
$130,000
Interest Rate
6.15%
Mortgage Type
Purchase Money Mortgage
Purchase Details
Closed on
Mar 27, 2008
Sold by
Shaffer Dawn M and Shaffer Adam L
Bought by
Shaffer Adam L and Shaffer Dawn M
Purchase Details
Closed on
Nov 28, 2005
Sold by
Gal Roger D and Gal Judit
Bought by
Graber Dawn M
Home Financials for this Owner
Home Financials are based on the most recent Mortgage that was taken out on this home.
Original Mortgage
$150,000
Interest Rate
6.13%
Mortgage Type
FHA
Purchase Details
Closed on
Mar 6, 2001
Sold by
Lee Canova Christian Joseph and Lee Janet
Bought by
Gal Roger D and Gal Judit
Purchase Details
Closed on
Sep 30, 1997
Sold by
Jones Ralph L
Bought by
Canova Christian J and Canova Janet L
Create a Home Valuation Report for This Property
The Home Valuation Report is an in-depth analysis detailing your home's value as well as a comparison with similar homes in the area
Home Values in the Area
Average Home Value in this Area
Purchase History
| Date | Buyer | Sale Price | Title Company |
|---|---|---|---|
| Goshe Jill | $280,000 | Landamerica | |
| Shaffer Adam L | -- | Attorney | |
| Graber Dawn M | $250,000 | Village Title Agency | |
| Gal Roger D | $38,000 | Midland Commerce Group | |
| Canova Christian J | $25,000 | -- |
Source: Public Records
Mortgage History
| Date | Status | Borrower | Loan Amount |
|---|---|---|---|
| Closed | Goshe Jill | $130,000 | |
| Previous Owner | Graber Dawn M | $150,000 |
Source: Public Records
Tax History Compared to Growth
Tax History
| Year | Tax Paid | Tax Assessment Tax Assessment Total Assessment is a certain percentage of the fair market value that is determined by local assessors to be the total taxable value of land and additions on the property. | Land | Improvement |
|---|---|---|---|---|
| 2025 | $5,859 | $125,045 | $18,396 | $106,649 |
| 2024 | $5,859 | $125,045 | $18,396 | $106,649 |
| 2023 | $5,859 | $125,045 | $18,396 | $106,649 |
| 2022 | $4,763 | $91,361 | $13,332 | $78,029 |
| 2021 | $4,464 | $91,361 | $13,332 | $78,029 |
| 2020 | $4,378 | $91,360 | $13,330 | $78,030 |
| 2019 | $4,319 | $84,480 | $15,380 | $69,100 |
| 2018 | $4,416 | $84,480 | $15,380 | $69,100 |
| 2017 | $4,203 | $84,480 | $15,380 | $69,100 |
| 2016 | $4,182 | $75,480 | $15,380 | $60,100 |
| 2015 | $4,203 | $75,480 | $15,380 | $60,100 |
| 2014 | $4,175 | $75,480 | $15,380 | $60,100 |
| 2013 | $4,209 | $75,640 | $15,380 | $60,260 |
Source: Public Records
Map
Nearby Homes
- 4441 Merlin Dr
- 1008 Dalby Cir
- 0 Kenway Blvd Unit 5162986
- 3704 Kenway Blvd
- 3943 Crest View Dr
- 3680 Kenway Blvd
- Mystique Plan at Brier Creek
- Prosperity Plan at Brier Creek
- Countryview Plan at Brier Creek
- Alcott Plan at Brier Creek
- 3672 Kenway Blvd
- 757 Southwood Dr
- 3683 Kenway Blvd
- 3630 Great Windsor Ln
- 683 Chilham Cir
- 3675 Kenway Blvd
- 3667 Kenway Blvd
- 3621 Great Windsor Ln
- 3832 Jacobs Ln
- 583 Knollwood Dr
- 905 Harring Rd
- 900 Harring Rd
- 890 Harring Rd
- 912 Harring Rd
- 878 Harring Rd
- 863 Harring Rd
- 866 Harring Rd
- 940 Harring Rd
- 4355 King Arthur Dr
- 4090 Arlington Rd
- 4118 Arlington Rd
- 4142 Arlington Rd
- 4168 Arlington Rd
- 4080 Arlington Rd
- 4166 Arlington Rd
- 4064 Arlington Rd
- 4178 Arlington Rd
- 4200 Arlington Rd
- 4137 Arlington Rd
- 4161 Arlington Rd