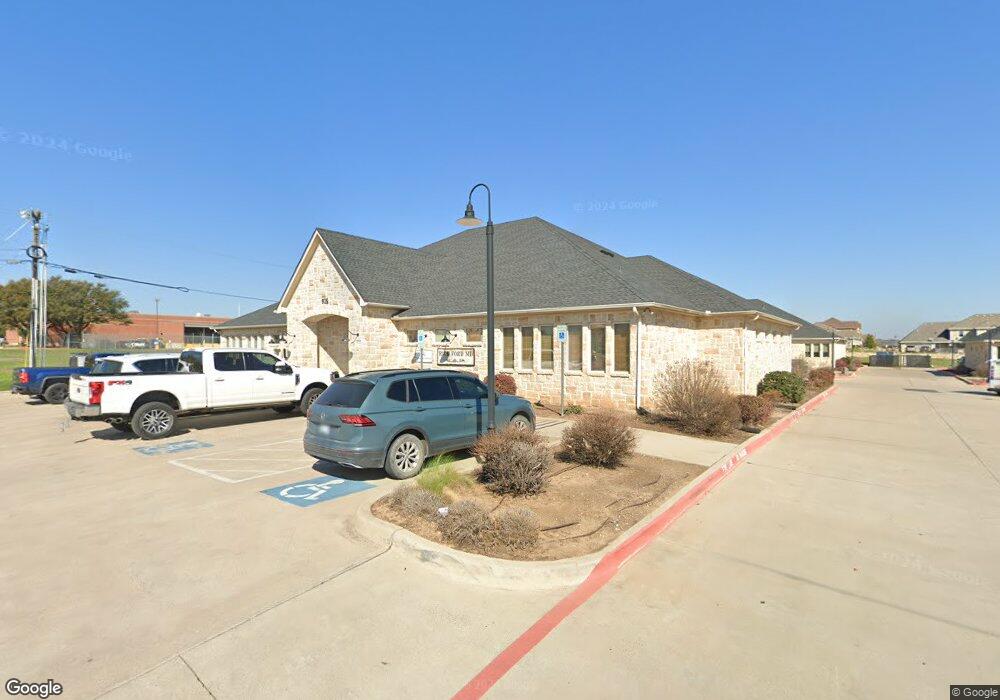
925 Hilltop Dr Weatherford, TX 76086
--
Bed
--
Bath
5,985
Sq Ft
0.56
Acres
About This Home
This home is located at 925 Hilltop Dr, Weatherford, TX 76086. 925 Hilltop Dr is a home located in Parker County with nearby schools including Ikard Elementary School, Hall Middle School, and Weatherford High School.
Ownership History
Date
Name
Owned For
Owner Type
Purchase Details
Closed on
Oct 7, 2019
Sold by
Malolo Llc
Bought by
Mesa Verde Midland Lp
Home Financials for this Owner
Home Financials are based on the most recent Mortgage that was taken out on this home.
Original Mortgage
$3,337,500
Outstanding Balance
$1,504,869
Interest Rate
3.5%
Mortgage Type
Purchase Money Mortgage
Purchase Details
Closed on
Jul 31, 2014
Sold by
Rjf Hilltop Properties Llc and Ford Ricky Joe
Bought by
Malolo Llc
Home Financials for this Owner
Home Financials are based on the most recent Mortgage that was taken out on this home.
Original Mortgage
$4,340,000
Interest Rate
4.2%
Mortgage Type
Purchase Money Mortgage
Purchase Details
Closed on
Mar 6, 2007
Sold by
Vls Partners and Fulton Linda M
Bought by
Ford Ricky Joe
Home Financials for this Owner
Home Financials are based on the most recent Mortgage that was taken out on this home.
Original Mortgage
$358,912
Interest Rate
6.02%
Mortgage Type
Purchase Money Mortgage
Create a Home Valuation Report for This Property
The Home Valuation Report is an in-depth analysis detailing your home's value as well as a comparison with similar homes in the area
Home Values in the Area
Average Home Value in this Area
Purchase History
| Date | Buyer | Sale Price | Title Company |
|---|---|---|---|
| Mesa Verde Midland Lp | -- | Rtt | |
| Malolo Llc | -- | None Available | |
| Ford Ricky Joe | -- | Stnt |
Source: Public Records
Mortgage History
| Date | Status | Borrower | Loan Amount |
|---|---|---|---|
| Open | Mesa Verde Midland Lp | $3,337,500 | |
| Previous Owner | Malolo Llc | $4,340,000 | |
| Previous Owner | Ford Ricky Joe | $358,912 |
Source: Public Records
Tax History Compared to Growth
Tax History
| Year | Tax Paid | Tax Assessment Tax Assessment Total Assessment is a certain percentage of the fair market value that is determined by local assessors to be the total taxable value of land and additions on the property. | Land | Improvement |
|---|---|---|---|---|
| 2025 | $19,275 | $1,400,000 | $122,610 | $1,277,390 |
| 2024 | $19,275 | $1,000,000 | $122,610 | $877,390 |
| 2023 | $19,275 | $1,000,000 | $122,610 | $877,390 |
| 2022 | $18,621 | $839,510 | $122,610 | $716,900 |
| 2021 | $20,161 | $839,510 | $122,610 | $716,900 |
| 2020 | $18,892 | $781,880 | $122,610 | $659,270 |
| 2019 | $19,967 | $781,880 | $122,610 | $659,270 |
| 2018 | $25,463 | $992,690 | $122,610 | $870,080 |
| 2017 | $26,377 | $1,002,460 | $122,610 | $879,850 |
| 2016 | $26,079 | $991,150 | $85,830 | $905,320 |
| 2015 | $25,539 | $991,150 | $85,830 | $905,320 |
| 2014 | -- | $1,072,930 | $61,310 | $1,011,620 |
Source: Public Records
Map
Nearby Homes
- 1234 Newcastle Dr
- 1029 Inverness Dr
- 1017 Inverness Dr
- 1305 Pecan Dr
- 916 El Dorado St
- 934 Eldorado St
- 936 Eldorado St
- 807 Hilltop Dr
- 2004 Hill Crest Ct
- 701 Terrace Dr
- 207 Camelot Dr
- 915 Austin Ct
- 946 Austin Ct
- 938 Austin Ct
- 952 Austin Ct
- TBD Vine St
- 1209 Timber Creek Dr
- 1628 Holland Lake Dr
- 228 Allen St
- The Chisholm Plan at Hickory Place Addition
- 941 Hilltop Dr
- 933 Hilltop Dr
- 945 Hilltop Dr
- 949 Hilltop Dr
- 949 Hilltop Dr Unit 1
- 930 Hilltop Dr
- 950 Hilltop Dr
- 953 Hilltop Dr
- 953 Hilltop Dr Unit 1
- 940 Hilltop Dr
- 1218 Newcastle Dr
- 1222 Newcastle Dr
- 1226 Newcastle Dr
- 2.5 acres SE Sante fe Dr
- 1153 Newcastle Dr
- 1230 Newcastle Dr
- 1149 Newcastle Dr
- 1142 Newcastle Dr
- 1134 Avendale Dr
- 1238 Newcastle Dr