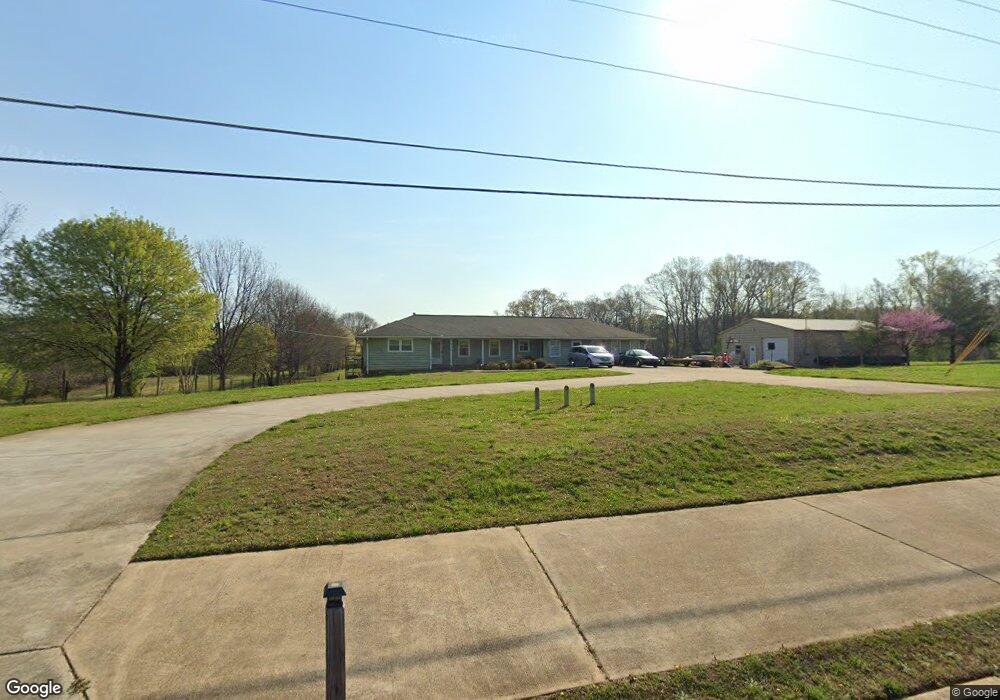
925 Mullinax Rd Alpharetta, GA 30004
Estimated Value: $539,000 - $701,257
3
Beds
2
Baths
2,436
Sq Ft
$252/Sq Ft
Est. Value
About This Home
This home is located at 925 Mullinax Rd, Alpharetta, GA 30004 and is currently estimated at $613,752, approximately $251 per square foot. 925 Mullinax Rd is a home located in Forsyth County with nearby schools including Midway Elementary School, DeSana Middle School, and Denmark High School.
Ownership History
Date
Name
Owned For
Owner Type
Purchase Details
Closed on
Oct 15, 2016
Sold by
Tahlia
Bought by
Putnam Mark Alfred and Putnam Lidia Estela
Current Estimated Value
Home Financials for this Owner
Home Financials are based on the most recent Mortgage that was taken out on this home.
Original Mortgage
$120,000
Outstanding Balance
$15,116
Interest Rate
3.5%
Mortgage Type
New Conventional
Estimated Equity
$598,636
Purchase Details
Closed on
May 13, 2013
Sold by
Icengole Marjorie L Triste
Bought by
Putnam Talia
Purchase Details
Closed on
Oct 27, 2012
Sold by
Burnell Diana I
Bought by
Icengole Marjorie L
Purchase Details
Closed on
Oct 26, 2012
Sold by
Burnell David Louis George
Bought by
Burnell Diana I
Purchase Details
Closed on
Dec 1, 2000
Sold by
Brooks Steven L and Brooks Suzanne F
Bought by
Burnell David G and Burnell Diana I
Home Financials for this Owner
Home Financials are based on the most recent Mortgage that was taken out on this home.
Original Mortgage
$168,450
Interest Rate
7.79%
Mortgage Type
New Conventional
Create a Home Valuation Report for This Property
The Home Valuation Report is an in-depth analysis detailing your home's value as well as a comparison with similar homes in the area
Home Values in the Area
Average Home Value in this Area
Purchase History
| Date | Buyer | Sale Price | Title Company |
|---|---|---|---|
| Putnam Mark Alfred | $200,000 | -- | |
| Putnam Talia | -- | -- | |
| Icengole Marjorie L | $222,630 | -- | |
| Burnell Diana I | $222,630 | -- | |
| Burnell David G | $210,700 | -- |
Source: Public Records
Mortgage History
| Date | Status | Borrower | Loan Amount |
|---|---|---|---|
| Open | Putnam Mark Alfred | $120,000 | |
| Previous Owner | Burnell David G | $168,450 |
Source: Public Records
Tax History Compared to Growth
Tax History
| Year | Tax Paid | Tax Assessment Tax Assessment Total Assessment is a certain percentage of the fair market value that is determined by local assessors to be the total taxable value of land and additions on the property. | Land | Improvement |
|---|---|---|---|---|
| 2025 | $3,988 | $281,368 | $126,280 | $155,088 |
| 2024 | $3,988 | $194,000 | $102,136 | $91,864 |
| 2023 | $3,639 | $194,000 | $102,136 | $91,864 |
| 2022 | $3,974 | $155,452 | $59,320 | $96,132 |
| 2021 | $3,821 | $155,452 | $59,320 | $96,132 |
| 2020 | $3,754 | $152,184 | $59,320 | $92,864 |
| 2019 | $3,182 | $124,232 | $53,388 | $70,844 |
| 2018 | $2,867 | $108,732 | $53,388 | $55,344 |
| 2017 | $2,817 | $101,488 | $49,432 | $52,056 |
| 2016 | $2,542 | $91,600 | $39,544 | $52,056 |
| 2015 | $2,547 | $91,600 | $39,544 | $52,056 |
| 2014 | $2,335 | $88,208 | $0 | $0 |
Source: Public Records
Map
Nearby Homes
- 406 Weatherstone Place
- 130 Fowler Hill Rd
- 5750 Bryson Ln
- 5740 Bryson Ln
- 470 Montgomery Ave
- 1650 Township Cir
- 915 Elmsbrook Ln
- 1465 Queens Ln
- 419 Grayson Way
- 368 Grayson Way
- 5512 Atlanta Hwy
- 310 Big Creek Way
- 1615 Waverly Glen Dr
- 1155 Hampton Oaks Dr
- 1620 Woodall View Ct
- 5870 Shiloh Woods Dr
- 5430 Breckinridge Ln
- 1655 Hampton Oaks Dr
- 6110 Cameo Ln
- 6130 Shiloh Woods Dr
- 105 Cumorah Trail
- 885 Mullinax Rd
- 965 Mullinax Rd
- 600 Fowler Rd
- 300 Cumorah Trail
- 115 Cumorah Trail
- 775 Streamview Way
- 785 Streamview Way
- 765 Streamview Way
- 805 Streamview Way
- 755 Streamview Way
- 825 Streamview Way
- 760 Streamview Way
- 745 Streamview Way
- 715 Wyngate Point Dr
- 1020 Preserve Ln
- 810 Streamview Way
- 725 Wyngate Point Dr
- 835 Streamview Way
- 750 Streamview Way