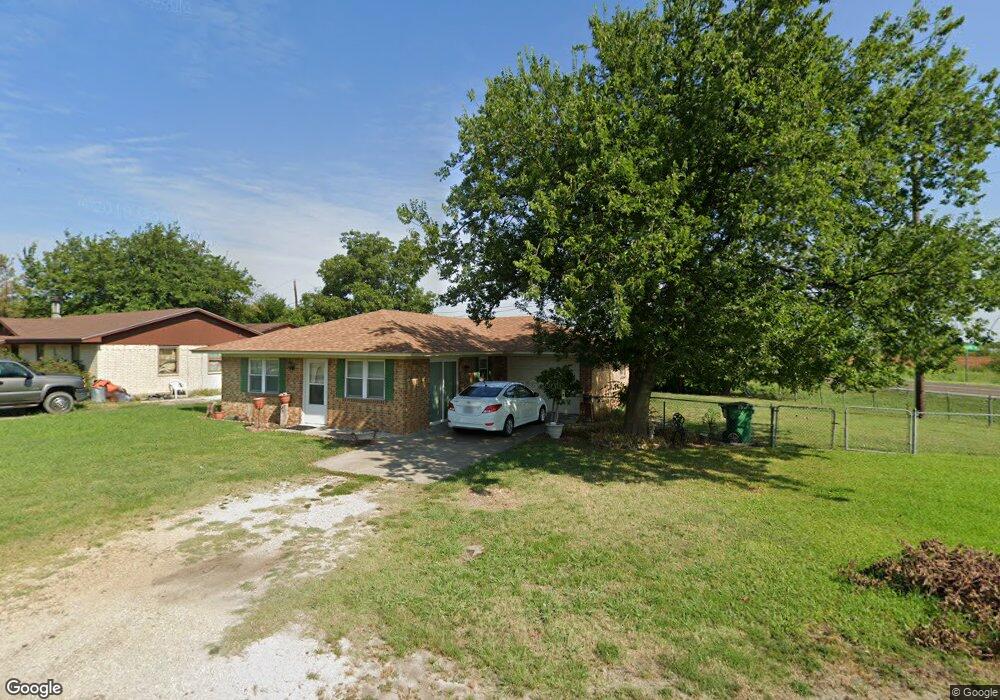
925 N 8th St Sanger, TX 76266
Estimated Value: $191,289 - $307,000
--
Bed
--
Bath
1,125
Sq Ft
$213/Sq Ft
Est. Value
About This Home
This home is located at 925 N 8th St, Sanger, TX 76266 and is currently estimated at $239,572, approximately $212 per square foot. 925 N 8th St is a home with nearby schools including Chisholm Trail Elementary School, Clear Creek Intermediate School, and Sanger Sixth Grade Campus.
Ownership History
Date
Name
Owned For
Owner Type
Purchase Details
Closed on
Jan 21, 2014
Sold by
Lowry Edith and Lowry Charles E
Bought by
Butler Adrian J
Current Estimated Value
Purchase Details
Closed on
Jan 30, 2006
Sold by
Hampton Jackie Janelle
Bought by
Lowry Charles E and Lowry Edith
Home Financials for this Owner
Home Financials are based on the most recent Mortgage that was taken out on this home.
Original Mortgage
$72,000
Interest Rate
6.18%
Mortgage Type
Fannie Mae Freddie Mac
Create a Home Valuation Report for This Property
The Home Valuation Report is an in-depth analysis detailing your home's value as well as a comparison with similar homes in the area
Home Values in the Area
Average Home Value in this Area
Purchase History
| Date | Buyer | Sale Price | Title Company |
|---|---|---|---|
| Butler Adrian J | $56,500 | None Available | |
| Lowry Charles E | -- | None Available |
Source: Public Records
Mortgage History
| Date | Status | Borrower | Loan Amount |
|---|---|---|---|
| Previous Owner | Lowry Charles E | $72,000 |
Source: Public Records
Tax History Compared to Growth
Tax History
| Year | Tax Paid | Tax Assessment Tax Assessment Total Assessment is a certain percentage of the fair market value that is determined by local assessors to be the total taxable value of land and additions on the property. | Land | Improvement |
|---|---|---|---|---|
| 2025 | $2,814 | $135,853 | $74,250 | $61,603 |
| 2024 | $2,814 | $139,243 | $66,946 | $72,297 |
| 2023 | $2,822 | $139,243 | $57,750 | $81,493 |
| 2022 | $3,108 | $140,134 | $52,250 | $87,884 |
| 2021 | $2,697 | $128,341 | $42,750 | $85,591 |
| 2020 | $2,421 | $109,421 | $42,750 | $66,671 |
| 2019 | $2,552 | $112,086 | $42,750 | $69,336 |
| 2018 | $2,189 | $95,651 | $42,750 | $52,901 |
| 2017 | $1,794 | $78,000 | $42,750 | $35,250 |
| 2016 | $1,483 | $64,500 | $23,750 | $40,750 |
| 2015 | -- | $64,448 | $23,750 | $40,698 |
| 2013 | -- | $74,628 | $23,750 | $50,878 |
Source: Public Records
Map
Nearby Homes
- 4551 Farm To Market Road 455
- 902 Plum St
- 4063 Farm To Market 455 W
- TBD Interstate 35
- 702 Peach St Unit 2
- 1149 Serendipity Cir
- 1010 Bolivar St
- 1209 Bolivar St
- 1009 Porter Place
- 411 Hughes St
- 109 S 5th St
- 710 W Willow St
- 126 Creekside Dr
- 136 Creekside Dr
- Dogwood Plan at Sable Creek
- Violet III Plan at Sable Creek
- Cypress II Plan at Sable Creek
- Dewberry Plan at Sable Creek
- Dogwood III Plan at Sable Creek
- Cypress Plan at Sable Creek