925 N H St Lompoc, CA 93436
Estimated Value: $1,355,709
Studio
--
Bath
--
Sq Ft
18,731
Sq Ft Lot
About This Home
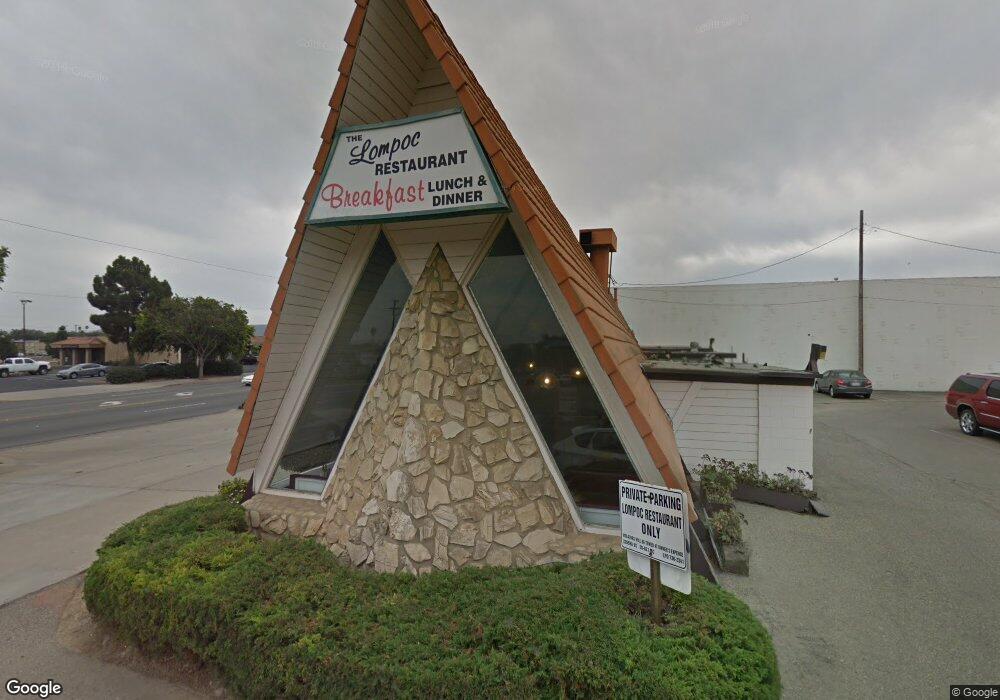
This home is located at 925 N H St, Lompoc, CA 93436 and is currently priced at $1,355,709. 925 N H St is a home located in Santa Barbara County with nearby schools including La Canada Elementary School, Lompoc Valley Middle School, and Lompoc High School.
Ownership History
Date
Name
Owned For
Owner Type
Purchase Details
Closed on
Apr 11, 2024
Sold by
Cvp Lompoc Epl Llc
Bought by
Mexsal Properties Llc
Current Estimated Value
Home Financials for this Owner
Home Financials are based on the most recent Mortgage that was taken out on this home.
Original Mortgage
$550,000
Outstanding Balance
$541,875
Interest Rate
6.94%
Mortgage Type
New Conventional
Purchase Details
Closed on
Sep 6, 2022
Sold by
Gomez Neftaly
Bought by
Cvp Lompoc Epl Llc
Home Financials for this Owner
Home Financials are based on the most recent Mortgage that was taken out on this home.
Original Mortgage
$878,100
Interest Rate
6.02%
Mortgage Type
Construction
Purchase Details
Closed on
Oct 6, 2001
Sold by
Nguyen Tippayawan
Bought by
Gomez Neftaly
Purchase Details
Closed on
Apr 17, 1996
Sold by
Hongwathanachai Suthat and Hongwathanachai Anchalee
Bought by
Nguyen Tippayawan
Create a Home Valuation Report for This Property
The Home Valuation Report is an in-depth analysis detailing your home's value as well as a comparison with similar homes in the area
Home Values in the Area
Average Home Value in this Area
Purchase History
| Date | Buyer | Sale Price | Title Company |
|---|---|---|---|
| Mexsal Properties Llc | $1,330,000 | First American Title | |
| Cvp Lompoc Epl Llc | $950,000 | Fidelity National Title | |
| Gomez Neftaly | $112,500 | Chicago Title Co | |
| Nguyen Tippayawan | -- | -- |
Source: Public Records
Mortgage History
| Date | Status | Borrower | Loan Amount |
|---|---|---|---|
| Open | Mexsal Properties Llc | $550,000 | |
| Previous Owner | Cvp Lompoc Epl Llc | $878,100 |
Source: Public Records
Tax History
| Year | Tax Paid | Tax Assessment Tax Assessment Total Assessment is a certain percentage of the fair market value that is determined by local assessors to be the total taxable value of land and additions on the property. | Land | Improvement |
|---|---|---|---|---|
| 2025 | $2,955 | $2,788,000 | $1,122,000 | $1,666,000 |
| 2023 | $2,955 | $950,000 | $250,000 | $700,000 |
| 2022 | $4,839 | $417,607 | $261,007 | $156,600 |
| 2021 | $4,888 | $409,420 | $255,890 | $153,530 |
| 2020 | $4,835 | $405,223 | $253,267 | $151,956 |
| 2019 | $4,755 | $397,278 | $248,301 | $148,977 |
| 2018 | $4,681 | $389,489 | $243,433 | $146,056 |
| 2017 | $4,595 | $381,853 | $238,660 | $143,193 |
| 2016 | $4,512 | $374,367 | $233,981 | $140,386 |
| 2014 | $4,416 | $361,523 | $225,953 | $135,570 |
Source: Public Records
Map
Nearby Homes
- 321 W North Ave Unit 133
- 701 E Pine Ave Unit 182
- 701 E Pine Ave Unit 176
- 701 E Pine Ave Unit 171
- 701 E Pine Ave Unit 161
- 610 E Pine Ave Unit 10
- 610 E Pine Ave Unit 29
- 610 E Pine Ave Unit 62
- 510 N I St
- 526 N L St
- 100 California 1
- 1407 N H St
- 908 Northpoint Place
- 809 E Barton Ave
- 1012 W Anthony Way
- 1213 Iris Ct
- 505 N 1st St
- 1100 N Third St
- 933 Bellflower Ln
- 1344 Village Meadows Dr
Your Personal Tour Guide
Ask me questions while you tour the home.