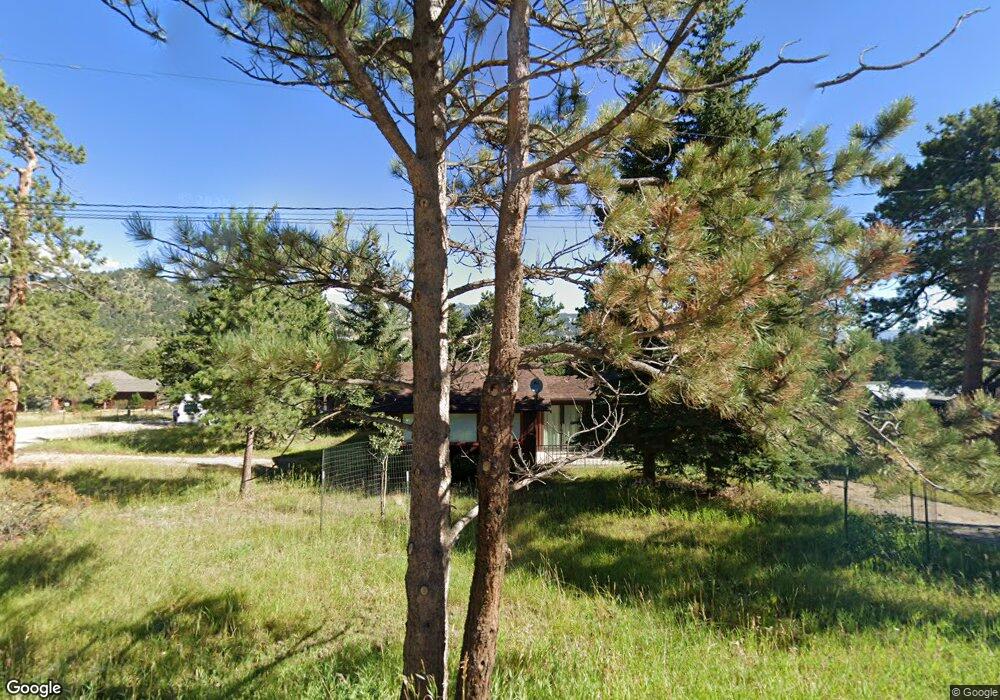
925 Riverside Dr Estes Park, CO 80517
Estimated Value: $504,225 - $565,000
2
Beds
1
Bath
870
Sq Ft
$620/Sq Ft
Est. Value
About This Home
This home is located at 925 Riverside Dr, Estes Park, CO 80517 and is currently estimated at $539,306, approximately $619 per square foot. 925 Riverside Dr is a home located in Larimer County with nearby schools including Estes Park K-5 School, Estes Park Options School, and Estes Park Middle School.
Ownership History
Date
Name
Owned For
Owner Type
Purchase Details
Closed on
Oct 17, 2017
Sold by
Howell Daniel B
Bought by
Howell Daniell B and The Daniell B Howell Revocable
Current Estimated Value
Purchase Details
Closed on
Jul 12, 2004
Sold by
Niemi Dave J and Rabel Heather
Bought by
Howell Daniel B
Purchase Details
Closed on
Jun 20, 2003
Sold by
Vannest Robert and Vannest Melinda
Bought by
Rabel Heather and Niemi David J
Home Financials for this Owner
Home Financials are based on the most recent Mortgage that was taken out on this home.
Original Mortgage
$166,300
Interest Rate
5.56%
Mortgage Type
Purchase Money Mortgage
Purchase Details
Closed on
Jul 25, 2001
Sold by
Tagg Charlotte M
Bought by
Vannest Robert and Vannest Melinda
Home Financials for this Owner
Home Financials are based on the most recent Mortgage that was taken out on this home.
Original Mortgage
$135,600
Interest Rate
7.07%
Create a Home Valuation Report for This Property
The Home Valuation Report is an in-depth analysis detailing your home's value as well as a comparison with similar homes in the area
Home Values in the Area
Average Home Value in this Area
Purchase History
| Date | Buyer | Sale Price | Title Company |
|---|---|---|---|
| Howell Daniell B | -- | None Available | |
| Howell Daniel B | $225,000 | -- | |
| Rabel Heather | $207,900 | -- | |
| Vannest Robert | $169,500 | -- |
Source: Public Records
Mortgage History
| Date | Status | Borrower | Loan Amount |
|---|---|---|---|
| Previous Owner | Rabel Heather | $166,300 | |
| Previous Owner | Vannest Robert | $135,600 |
Source: Public Records
Tax History Compared to Growth
Tax History
| Year | Tax Paid | Tax Assessment Tax Assessment Total Assessment is a certain percentage of the fair market value that is determined by local assessors to be the total taxable value of land and additions on the property. | Land | Improvement |
|---|---|---|---|---|
| 2025 | $2,222 | $34,800 | $10,586 | $24,214 |
| 2024 | $2,197 | $34,800 | $10,586 | $24,214 |
| 2022 | $1,812 | $24,305 | $6,881 | $17,424 |
| 2021 | $1,860 | $25,004 | $7,079 | $17,925 |
| 2020 | $1,603 | $21,236 | $7,079 | $14,157 |
| 2019 | $1,591 | $21,236 | $7,079 | $14,157 |
| 2018 | $1,503 | $19,433 | $7,560 | $11,873 |
| 2017 | $1,511 | $19,433 | $7,560 | $11,873 |
| 2016 | $1,513 | $20,147 | $8,119 | $12,028 |
| 2015 | $1,494 | $20,150 | $8,120 | $12,030 |
| 2014 | $1,271 | $17,620 | $7,400 | $10,220 |
Source: Public Records
Map
Nearby Homes
- 1141 Wallace Ln
- 1352 Alpenglow Ln
- 0 Alpaca Farm Way
- 1263 Broadview
- 1111 Prosper Ln
- 683 Cedar Ridge Cir Unit 2
- 677 Cedar Ridge Cir Unit 5
- 1401 High Dr
- 658 Cedar Ridge Cir Unit 1
- 1252 Giant Track Rd
- 467 Riverside Dr
- 1575 Lower Broadview Rd
- 647 Park River Place Unit 647
- 2800 Marys Lake Rd
- 831 Larkspur Rd
- 811 Larkspur Rd
- 1565 Highway 66 Unit 46
- 1565 Highway 66 Unit 33
- 1565 Highway 66 Unit 27
- 1565 Highway 66 Unit 49
- 1190 Strong Ave
- 909 1/2 Riverside Dr
- 909 Riverside Dr
- 909 Riverside Dr
- 955 Riverside Dr
- 910 Riverside Dr
- 1160 Strong Ave
- 950 Riverside Dr
- 1140 Strong Ave
- 910 Riverside Dr
- 975 Riverside Dr
- 1161 Strong Ave
- 960 Riverside Dr Unit 9
- 960 Riverside Dr Unit 7
- 960 Riverside Dr Unit 6
- 960 Riverside Dr Unit 5
- 960 Riverside Dr Unit 4
- 960 Riverside Dr Unit 3
- 960 Riverside Dr Unit 2
- 960 Riverside Dr Unit 1