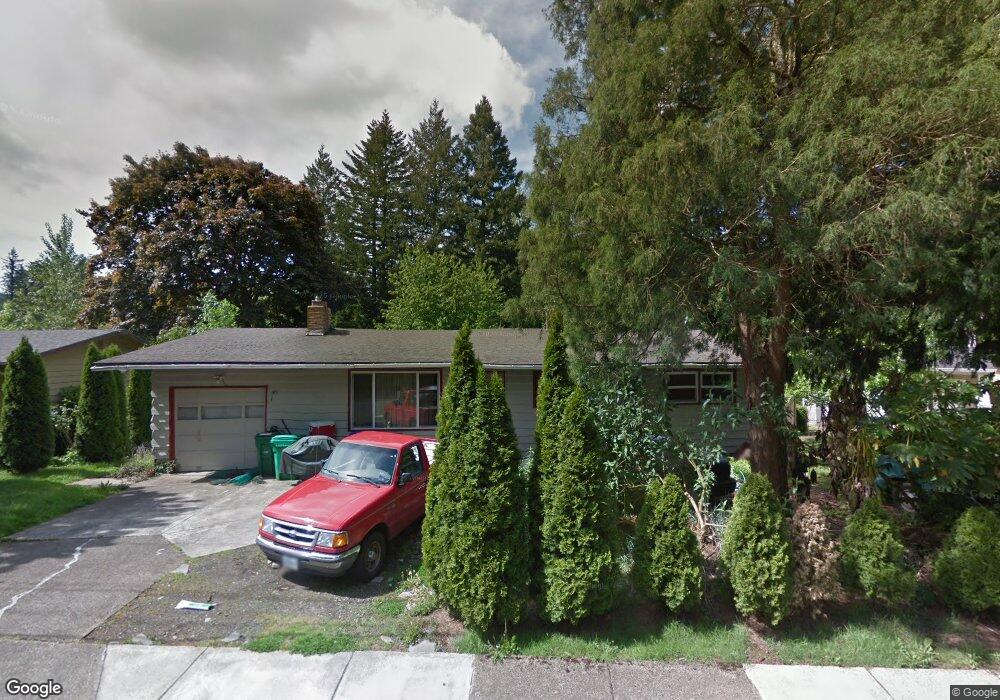
925 SE Roberts Ave Gresham, OR 97080
Historic Southeast NeighborhoodEstimated Value: $399,000 - $448,126
4
Beds
2
Baths
2,064
Sq Ft
$209/Sq Ft
Est. Value
About This Home
This home is located at 925 SE Roberts Ave, Gresham, OR 97080 and is currently estimated at $430,532, approximately $208 per square foot. 925 SE Roberts Ave is a home located in Multnomah County with nearby schools including East Gresham Elementary School, Dexter McCarty Middle School, and Gresham High School.
Ownership History
Date
Name
Owned For
Owner Type
Purchase Details
Closed on
Mar 7, 2003
Sold by
Wachovia Bank Na
Bought by
Ritchey Michael L and Ritchey Carmil White
Current Estimated Value
Home Financials for this Owner
Home Financials are based on the most recent Mortgage that was taken out on this home.
Original Mortgage
$136,360
Interest Rate
5.83%
Mortgage Type
FHA
Purchase Details
Closed on
Jun 20, 2002
Sold by
Kirby Kenneth J and Shenkman Jennifer J
Bought by
First Union National Bank
Purchase Details
Closed on
Feb 25, 1998
Sold by
Brown Jocelyn K
Bought by
Kirby Kenneth L and Shenkman Jennifer J
Home Financials for this Owner
Home Financials are based on the most recent Mortgage that was taken out on this home.
Original Mortgage
$112,500
Interest Rate
10.12%
Create a Home Valuation Report for This Property
The Home Valuation Report is an in-depth analysis detailing your home's value as well as a comparison with similar homes in the area
Home Values in the Area
Average Home Value in this Area
Purchase History
| Date | Buyer | Sale Price | Title Company |
|---|---|---|---|
| Ritchey Michael L | $138,500 | Fatco | |
| First Union National Bank | $123,186 | First American Title Ins Co | |
| Kirby Kenneth L | $125,000 | Transnation Title Insurance |
Source: Public Records
Mortgage History
| Date | Status | Borrower | Loan Amount |
|---|---|---|---|
| Previous Owner | Ritchey Michael L | $136,360 | |
| Previous Owner | Kirby Kenneth L | $112,500 |
Source: Public Records
Tax History
| Year | Tax Paid | Tax Assessment Tax Assessment Total Assessment is a certain percentage of the fair market value that is determined by local assessors to be the total taxable value of land and additions on the property. | Land | Improvement |
|---|---|---|---|---|
| 2025 | $4,693 | $230,610 | -- | -- |
| 2024 | $4,492 | $223,900 | -- | -- |
| 2023 | $4,093 | $217,380 | $0 | $0 |
| 2022 | $3,978 | $211,050 | $0 | $0 |
| 2021 | $3,878 | $204,910 | $0 | $0 |
| 2020 | $3,649 | $198,950 | $0 | $0 |
| 2019 | $3,554 | $193,160 | $0 | $0 |
| 2018 | $3,388 | $187,540 | $0 | $0 |
| 2017 | $3,251 | $182,080 | $0 | $0 |
| 2016 | $2,866 | $176,780 | $0 | $0 |
| 2015 | $2,805 | $171,640 | $0 | $0 |
| 2014 | $2,736 | $166,650 | $0 | $0 |
Source: Public Records
Map
Nearby Homes
- 511 SE 15th St
- 1414 SE Beech Place
- 417 SE Roberts Ave
- 415 SE Roberts Ave
- 55 SW Lovhar Dr
- 0 SW Miller Ct Unit 470855683
- 1918 SE Regner Rd
- 1715 SE 5th St Unit 1725
- 2024 SE Spruce Ave
- 1700 SE 4th St
- 1949 SE Palmquist Rd Unit 51
- 1949 SE Palmquist Rd Unit 91
- 1949 SE Palmquist Rd Unit 121
- 450 SE Hogan Rd
- 4740 SE 2nd St
- 4764 SE 2nd St
- 4667 SE 2nd St
- 1407 SW Walters Dr
- 234 NE Cleveland Ave
- 2137 SE 15th Aly
- 927 SE Roberts Ave
- 923 SE Dowsett Ln
- 923 SE Dowsett Ln Unit 925
- 937 SE Roberts Ave
- 909 SE Roberts Ave
- 931 SE Roberts Ave
- 903 SE Roberts Ave
- 941 SE Roberts Ave
- 939 SE Roberts Ave
- 0 SE Dowsett Ln Unit 3 13590927
- 0 SE Dowsett Ln Unit 2 13577142
- 0 SE Dowsett Ln
- 725 SE 9th Relisted
- 938 SE Roberts Ave
- 0 SE Roberts Ave
- 0 SE Roberts Ave
- 944 SE Roberts Ave
- 860 SE Roberts Ave
- 975 SE Roberts Ave
- 720 SE 9th St
Your Personal Tour Guide
Ask me questions while you tour the home.