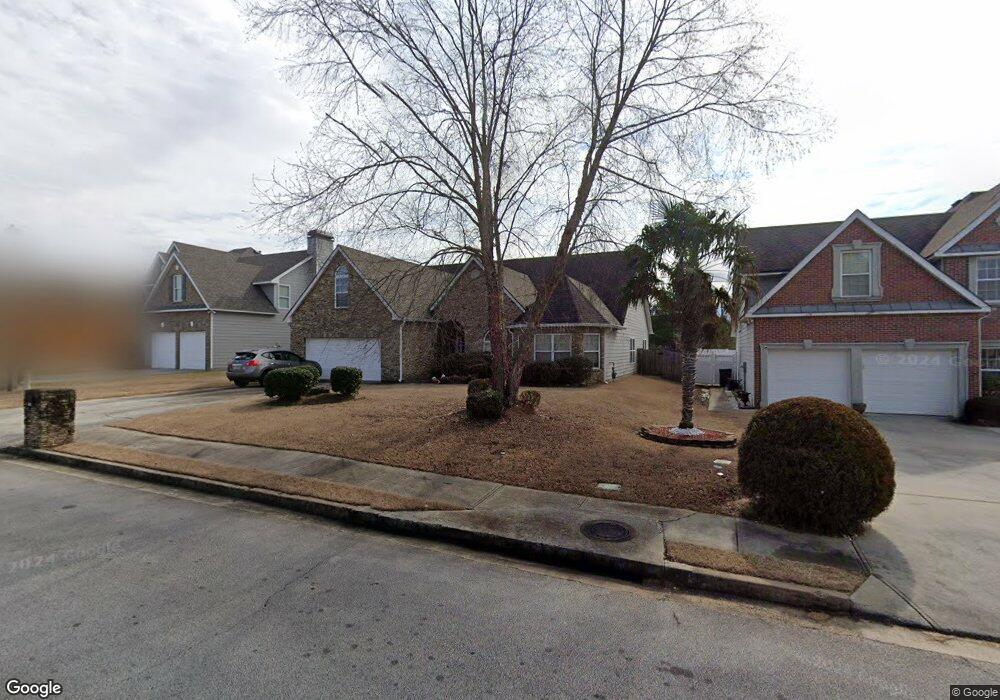
925 Southfork Dr Unit 1 Loganville, GA 30052
Estimated Value: $424,000 - $485,000
4
Beds
4
Baths
3,598
Sq Ft
$123/Sq Ft
Est. Value
About This Home
This home is located at 925 Southfork Dr Unit 1, Loganville, GA 30052 and is currently estimated at $444,091, approximately $123 per square foot. 925 Southfork Dr Unit 1 is a home located in Walton County with nearby schools including Bay Creek Elementary School, Loganville Middle School, and Loganville High School.
Ownership History
Date
Name
Owned For
Owner Type
Purchase Details
Closed on
Jan 14, 2016
Sold by
Poe David W
Bought by
Newsome Alan and Newsome Valerie
Current Estimated Value
Home Financials for this Owner
Home Financials are based on the most recent Mortgage that was taken out on this home.
Original Mortgage
$189,600
Outstanding Balance
$150,941
Interest Rate
3.99%
Mortgage Type
New Conventional
Estimated Equity
$293,150
Purchase Details
Closed on
Jan 16, 2009
Sold by
Federal National Mortgage Association
Bought by
Poe David W and Poe Billie J
Purchase Details
Closed on
Mar 11, 2008
Sold by
Nationwide Mtg Co
Bought by
Fedl Natl Mtg Assn
Purchase Details
Closed on
Mar 5, 2008
Sold by
Crace Jason L
Bought by
Nationwide Adv Mtg Co
Purchase Details
Closed on
May 31, 2007
Sold by
Miramar Prop Inc
Bought by
Crace Jason L
Home Financials for this Owner
Home Financials are based on the most recent Mortgage that was taken out on this home.
Original Mortgage
$26,990
Interest Rate
6.16%
Mortgage Type
New Conventional
Create a Home Valuation Report for This Property
The Home Valuation Report is an in-depth analysis detailing your home's value as well as a comparison with similar homes in the area
Home Values in the Area
Average Home Value in this Area
Purchase History
| Date | Buyer | Sale Price | Title Company |
|---|---|---|---|
| Newsome Alan | $189,600 | -- | |
| Poe David W | -- | -- | |
| Fedl Natl Mtg Assn | -- | -- | |
| Nationwide Adv Mtg Co | $269,300 | -- | |
| Crace Jason L | $269,900 | -- |
Source: Public Records
Mortgage History
| Date | Status | Borrower | Loan Amount |
|---|---|---|---|
| Open | Newsome Alan | $189,600 | |
| Previous Owner | Crace Jason L | $26,990 |
Source: Public Records
Tax History Compared to Growth
Tax History
| Year | Tax Paid | Tax Assessment Tax Assessment Total Assessment is a certain percentage of the fair market value that is determined by local assessors to be the total taxable value of land and additions on the property. | Land | Improvement |
|---|---|---|---|---|
| 2024 | $2,606 | $173,080 | $27,600 | $145,480 |
| 2023 | $730 | $167,800 | $27,600 | $140,200 |
| 2022 | $918 | $144,000 | $22,400 | $121,600 |
| 2021 | $918 | $120,640 | $18,000 | $102,640 |
| 2020 | $941 | $108,080 | $18,000 | $90,080 |
| 2019 | $961 | $96,400 | $15,200 | $81,200 |
| 2018 | $961 | $96,400 | $15,200 | $81,200 |
| 2017 | $4,036 | $91,600 | $15,200 | $76,400 |
| 2016 | $2,945 | $88,120 | $15,200 | $72,920 |
| 2015 | $2,741 | $81,000 | $13,600 | $67,400 |
| 2014 | $2,097 | $60,120 | $12,000 | $48,120 |
Source: Public Records
Map
Nearby Homes
- 509 Georgia Cir
- 412 Ashley Ln
- 907 Southfork Dr
- 521 Georgia Cir
- 453 Tara Commons Cir
- 112 Tara Blvd
- 152 Tara Commons Dr
- 3725 Lochview Dr
- 233 Tara Commons Walk
- 502 Clayborne Way
- 502 Clayborne Way Unit 249A
- 148 Logan Pass Dr
- 309 Westfall Terrace
- 309 Westfall Terrace Unit 223A
- 417 Westmarch Cir
- 306 Westfall Terrace
- 306 Westfall Terrace Unit 199A
- 304 Westfall Terrace Unit 200A
- 304 Westfall Terrace
- 310 Westfall Terrace
- 923 Southfork Dr
- 927 Southfork Dr
- 903 Southfork Dr
- 921 Southfork Dr Unit 1
- 929 Southfork Dr Unit 1
- 924 Southfork Dr
- 919 Southfork Dr Unit 1
- 926 Southfork Dr
- 581 Georgia Cir
- 405 Ashley Ln
- 407 Ashley Ln
- 920 Southfork Dr
- 920 Southfork Dr
- 403 Ashley Ln Unit 1
- 579 Georgia Cir
- 579 Georgia Cir Unit 151
- 409 Ashley Ln
- 585 Georgia Cir
- 0 Ashley Ln Unit 3260160
- 0 Ashley Ln Unit 7075408