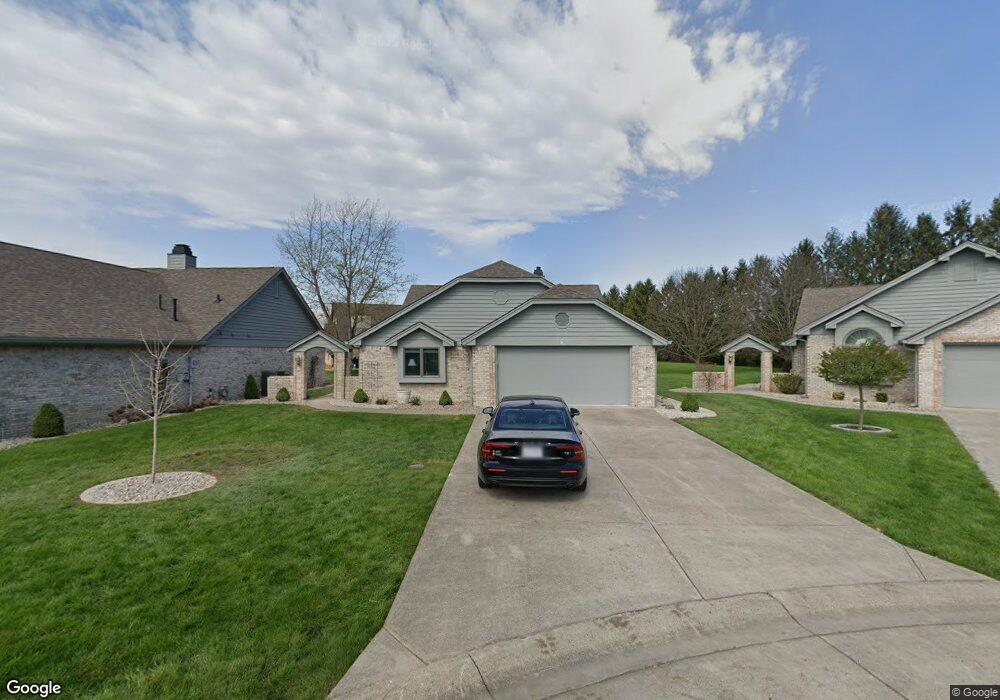
925 Summerlin Ct Unit 82 Anderson, IN 46011
Estimated Value: $271,191 - $316,000
2
Beds
2
Baths
1,700
Sq Ft
$173/Sq Ft
Est. Value
About This Home
This home is located at 925 Summerlin Ct Unit 82, Anderson, IN 46011 and is currently estimated at $294,298, approximately $173 per square foot. 925 Summerlin Ct Unit 82 is a home located in Madison County with nearby schools including Edgewood Elementary School, Highland Middle School, and Anderson High School.
Ownership History
Date
Name
Owned For
Owner Type
Purchase Details
Closed on
Sep 24, 2021
Sold by
Archer Janice M
Bought by
Cookston Joseph L and Cookston Merry R
Current Estimated Value
Home Financials for this Owner
Home Financials are based on the most recent Mortgage that was taken out on this home.
Original Mortgage
$146,000
Outstanding Balance
$132,269
Interest Rate
2.8%
Mortgage Type
New Conventional
Estimated Equity
$162,029
Purchase Details
Closed on
Jul 6, 2021
Sold by
Archer Grover F and Archer Janice M
Bought by
Archer Janice M
Purchase Details
Closed on
Nov 23, 2009
Sold by
Laughlin Gregory J and Lacey Michael C
Bought by
Archer Grover F and Archer Janice M
Create a Home Valuation Report for This Property
The Home Valuation Report is an in-depth analysis detailing your home's value as well as a comparison with similar homes in the area
Home Values in the Area
Average Home Value in this Area
Purchase History
| Date | Buyer | Sale Price | Title Company |
|---|---|---|---|
| Cookston Joseph L | -- | None Listed On Document | |
| Archer Janice M | -- | None Available | |
| Archer Grover F | -- | -- |
Source: Public Records
Mortgage History
| Date | Status | Borrower | Loan Amount |
|---|---|---|---|
| Open | Cookston Joseph L | $146,000 |
Source: Public Records
Tax History Compared to Growth
Tax History
| Year | Tax Paid | Tax Assessment Tax Assessment Total Assessment is a certain percentage of the fair market value that is determined by local assessors to be the total taxable value of land and additions on the property. | Land | Improvement |
|---|---|---|---|---|
| 2025 | $2,216 | $200,400 | $20,800 | $179,600 |
| 2024 | $2,216 | $200,400 | $20,800 | $179,600 |
| 2023 | $2,021 | $182,900 | $19,900 | $163,000 |
| 2022 | $2,103 | $188,200 | $19,300 | $168,900 |
| 2021 | $1,864 | $167,300 | $19,100 | $148,200 |
| 2020 | $1,819 | $162,800 | $18,100 | $144,700 |
| 2019 | $1,812 | $162,100 | $18,100 | $144,000 |
| 2018 | $1,707 | $150,500 | $18,100 | $132,400 |
| 2017 | $1,493 | $149,300 | $18,100 | $131,200 |
| 2016 | $1,462 | $146,200 | $17,500 | $128,700 |
| 2014 | $1,451 | $145,100 | $16,600 | $128,500 |
| 2013 | $1,451 | $145,100 | $16,600 | $128,500 |
Source: Public Records
Map
Nearby Homes
- 2407 Caramore Cir
- Lot 34 Doe Meadow Dr
- Lot 33 Doe Meadow Dr
- Lot 28 Doe Meadow Dr
- 1224 Greendale Rd
- Lot 2 Vanderbilt Dr
- 2415 Bramble Way
- 2515 Winterwood Ct
- 2511 Winterwood Ln
- 2525 Winterwood Ln
- 2519 Winterwood Ln
- 2526 Winterwood Ln
- 2534 Winterwood Ln
- 1641 Hillcrest Ave
- 1321 Greenway Dr
- 807 Forest Dr
- 925 Forest Dr
- 1110 van Buskirk Rd
- 1905 E Balsam Ct
- 1512 W 3rd St
- 925 Summerlin Ct
- 921 Summerlin Ct
- 929 Summerlin Ct
- 917 Summerlin Ct Unit 80
- 930 Greystone Ct
- 924 Greystone Ct
- 933 Summerlin Ct
- 934 Summerlin Ct
- 934 Summerlin Ct Unit 138
- 916 Greystone Ct
- 928 Greystone Ct
- 922 Summerlin Ct
- 2329 Cedar Bend Dr
- 926 Summerlin Ct
- 2327 Cedar Bend Dr
- 930 Summerlin Ct
- 2415 Cedar Bend
- 2325 Cedar Bend
- 931 Greystone Ct
- 2405 Sagamore Dr