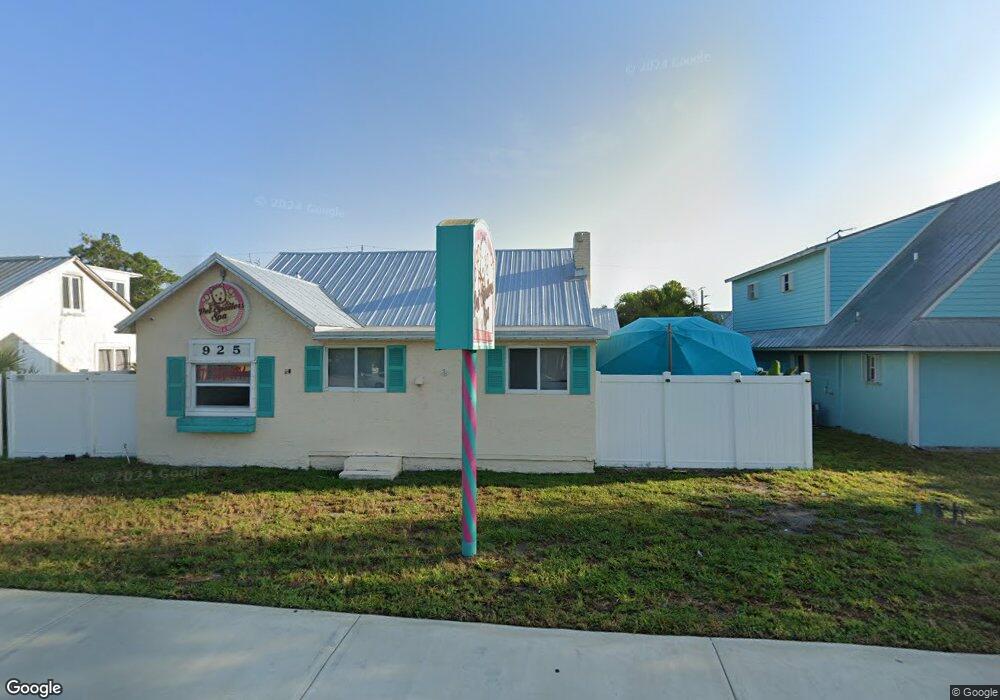
925 SW Martin Downs Blvd Palm City, FL 34990
Estimated Value: $315,399
--
Bed
2
Baths
1,352
Sq Ft
$233/Sq Ft
Est. Value
About This Home
This home is located at 925 SW Martin Downs Blvd, Palm City, FL 34990 and is currently estimated at $315,399, approximately $233 per square foot. 925 SW Martin Downs Blvd is a home located in Martin County with nearby schools including Bessey Creek Elementary School, Hidden Oaks Middle School, and Martin County High School.
Ownership History
Date
Name
Owned For
Owner Type
Purchase Details
Closed on
Mar 20, 2017
Sold by
Rogers James
Bought by
Moreaullc Moore
Current Estimated Value
Purchase Details
Closed on
Oct 21, 2013
Sold by
Sine Charles C and Sine Rita M
Bought by
Rogers James
Home Financials for this Owner
Home Financials are based on the most recent Mortgage that was taken out on this home.
Original Mortgage
$85,000
Interest Rate
5%
Mortgage Type
Seller Take Back
Purchase Details
Closed on
Mar 16, 2010
Sold by
Swan Robert E and Swan Judy M
Bought by
Sine Charles C and Sine Rita M
Purchase Details
Closed on
May 2, 2000
Sold by
Gamba Paul A and Gamba Kathleen Gamba
Bought by
Swan Robert E and Swan Judy M
Home Financials for this Owner
Home Financials are based on the most recent Mortgage that was taken out on this home.
Original Mortgage
$100,000
Interest Rate
8.24%
Mortgage Type
Commercial
Create a Home Valuation Report for This Property
The Home Valuation Report is an in-depth analysis detailing your home's value as well as a comparison with similar homes in the area
Home Values in the Area
Average Home Value in this Area
Purchase History
| Date | Buyer | Sale Price | Title Company |
|---|---|---|---|
| Moreaullc Moore | $175,000 | Attorney | |
| Rogers James | $120,000 | Attorney | |
| Sine Charles C | $175,000 | Merit Title Inc | |
| Swan Robert E | $130,000 | -- |
Source: Public Records
Mortgage History
| Date | Status | Borrower | Loan Amount |
|---|---|---|---|
| Previous Owner | Rogers James | $85,000 | |
| Previous Owner | Swan Robert E | $100,000 |
Source: Public Records
Tax History Compared to Growth
Tax History
| Year | Tax Paid | Tax Assessment Tax Assessment Total Assessment is a certain percentage of the fair market value that is determined by local assessors to be the total taxable value of land and additions on the property. | Land | Improvement |
|---|---|---|---|---|
| 2025 | $3,654 | $239,333 | -- | -- |
| 2024 | $3,349 | $217,576 | -- | -- |
| 2023 | $3,349 | $197,797 | $0 | $0 |
| 2022 | $2,992 | $179,816 | $79,860 | $99,956 |
| 2021 | $2,854 | $164,893 | $69,878 | $95,015 |
| 2020 | $2,741 | $157,040 | $66,550 | $90,490 |
| 2019 | $2,748 | $155,480 | $66,550 | $88,930 |
| 2018 | $2,622 | $149,250 | $66,550 | $82,700 |
| 2017 | $1,230 | $101,400 | $66,550 | $34,850 |
| 2016 | $1,238 | $101,400 | $66,550 | $34,850 |
| 2015 | $1,234 | $101,400 | $66,550 | $34,850 |
| 2014 | $1,234 | $104,670 | $66,550 | $38,120 |
Source: Public Records
Map
Nearby Homes
- 942 SW 27th St
- 923 SW 29th St
- 985 SW 29th Terrace
- 872 SW 30th St
- 1287 SW Sunset Trail
- 1030 SW 31st St
- 2503 SW Parkside Dr
- 3529 SW Cornell Ave
- 948 SW 33rd St
- 2467 SW Nettles Ct
- 1380 Lago Cir
- 1950 SW Palm City Rd Unit 3-207
- 1950 SW Palm City Rd Unit 13-301
- 1950 SW Palm City Rd Unit 11-105
- 1950 SW Palm City Rd Unit 12103
- 1950 SW Palm City Rd Unit 3-201
- 1950 SW Palm City Rd Unit 9108
- 1950 SW Palm City Rd Unit 5109
- 1950 SW Palm City Rd Unit 6-202
- 1950 SW Palm City Rd Unit 4203
- 2654 SW Conch Cove Ln
- 935 SW Martin Downs Blvd
- 0 SW Reilley Ave
- 2658 SW Reilley Ave
- 2624 SW Conch Cove Ln Unit 1a
- 2624 SW Conch Cove Ln
- 900 SW Martin Downs Blvd
- 2604 SW Conch Cove Ln
- 2617 SW Reilley Ave
- 2633 SW Conch Cove Ln
- 2603 SW Conch Cove Ln
- 2613 SW Conch Cove Ln
- 2623 SW Conch Cove Ln
- 2584 SW Conch Cove Ln
- 2587 SW Reilley Ave
- 998 SW Spruce St
- 922 SW 27th St
- 2564 SW Conch Cove Ln
- 2573 SW Conch Cove Ln
- 882 SW 27th St