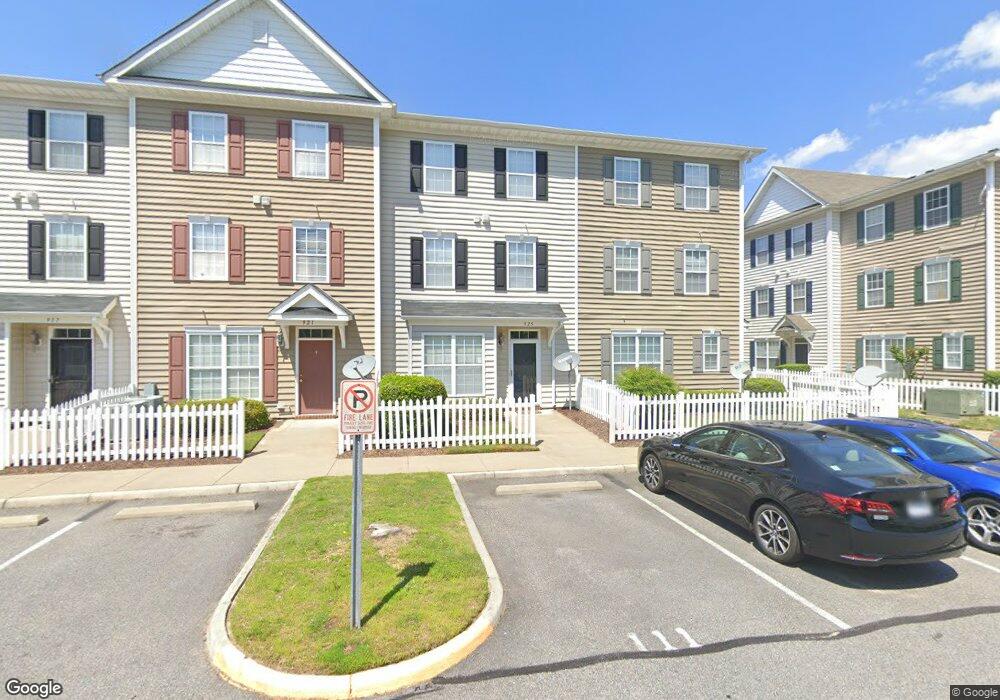
925 Teton Cir Suffolk, VA 23435
Sleepy Hole NeighborhoodEstimated Value: $259,000 - $272,000
3
Beds
3
Baths
1,696
Sq Ft
$157/Sq Ft
Est. Value
About This Home
This home is located at 925 Teton Cir, Suffolk, VA 23435 and is currently estimated at $265,474, approximately $156 per square foot. 925 Teton Cir is a home located in Suffolk City with nearby schools including Creekside Elementary School, John Yeates Middle School, and Nansemond River High School.
Ownership History
Date
Name
Owned For
Owner Type
Purchase Details
Closed on
May 1, 2017
Bought by
Logan Nakeea J
Current Estimated Value
Home Financials for this Owner
Home Financials are based on the most recent Mortgage that was taken out on this home.
Original Mortgage
$136,472
Outstanding Balance
$112,452
Interest Rate
4.03%
Estimated Equity
$153,022
Purchase Details
Closed on
Dec 28, 2015
Sold by
Tawes Joshua M and Stile Anthony
Bought by
Accelerated Rental Properties Llc A Virg
Purchase Details
Closed on
Aug 26, 2015
Sold by
Secretary Of Us Dept Of Hud
Bought by
Tawes Joshua M and Stile Anthony
Purchase Details
Closed on
Apr 23, 2015
Sold by
Ocwen Loan Servicing Llc
Bought by
Secretary Of The Us Dept Of Hu
Purchase Details
Closed on
Mar 6, 2015
Sold by
Surety Trustees Llc Sub Tr and Hayden Gregory V
Bought by
Ocwen Loan Servicing Llc
Create a Home Valuation Report for This Property
The Home Valuation Report is an in-depth analysis detailing your home's value as well as a comparison with similar homes in the area
Home Values in the Area
Average Home Value in this Area
Purchase History
| Date | Buyer | Sale Price | Title Company |
|---|---|---|---|
| Logan Nakeea J | -- | -- | |
| Accelerated Rental Properties Llc A Virg | -- | None Available | |
| Tawes Joshua M | $101,000 | Attorney | |
| Secretary Of The Us Dept Of Hu | -- | -- | |
| Ocwen Loan Servicing Llc | $106,140 | -- |
Source: Public Records
Mortgage History
| Date | Status | Borrower | Loan Amount |
|---|---|---|---|
| Open | Ocwen Loan Servicing Llc | $136,472 | |
| Closed | Ocwen Loan Servicing Llc | -- |
Source: Public Records
Tax History
| Year | Tax Paid | Tax Assessment Tax Assessment Total Assessment is a certain percentage of the fair market value that is determined by local assessors to be the total taxable value of land and additions on the property. | Land | Improvement |
|---|---|---|---|---|
| 2025 | $2,719 | $245,700 | $50,000 | $195,700 |
| 2024 | $2,719 | $230,400 | $50,000 | $180,400 |
| 2023 | $2,555 | $217,300 | $50,000 | $167,300 |
| 2022 | $2,140 | $196,300 | $50,000 | $146,300 |
| 2021 | $1,866 | $168,100 | $40,000 | $128,100 |
| 2020 | $1,793 | $161,500 | $40,000 | $121,500 |
| 2019 | $1,637 | $147,500 | $40,000 | $107,500 |
| 2018 | $1,651 | $134,800 | $40,000 | $94,800 |
| 2017 | $1,420 | $132,700 | $40,000 | $92,700 |
| 2016 | $1,669 | $156,000 | $40,000 | $116,000 |
| 2015 | $888 | $162,100 | $40,000 | $122,100 |
| 2014 | $888 | $162,100 | $40,000 | $122,100 |
Source: Public Records
Map
Nearby Homes
- 923 Teton Cir Unit 110
- 3509 Burlington St Unit 23
- 5027 Prestwick St
- 5540 Weatherby Way
- 5018 Huntclub Chase
- 200 Catalpa Ct
- 3503 Derby Cove
- 5040 Huntclub Chase
- 113 Everclear Dr
- 3972 Pughsville Rd
- 3605 Canal Turn Ct
- 5015 Kelso St
- 3004 Doncaster Dr
- LOT 80 Pughsville Rd
- 204 Bennetts Grove Ln
- 6078 Mainsail Ln
- 1005 Opal St Unit 105
- 1002 Opal St Unit 104
- 13A Pughsville Rd
- 317 Rhapsody Dr
- 929 Teton Cir
- 921 Teton Cir
- 927 Teton Cir
- 931 Teton Cir
- 923 Teton Cir
- 917 Teton Cir
- 917 Teton Cir Unit 107
- 919 Teton Cir
- 919 Teton Cir Unit 108
- 913 Teton Cir
- 915 Teton Cir
- 1103 Teton Cir
- 1107 Teton Cir
- 909 Teton Cir
- 911 Teton Cir Unit 104
- 911 Teton Cir
- 1115 Teton Cir
- 1115 Teton Cir Unit 98
- 1111 Teton Cir
- 905 Teton Cir
Your Personal Tour Guide
Ask me questions while you tour the home.