Estimated Value: $190,000 - $256,000
--
Bed
3
Baths
1,514
Sq Ft
$146/Sq Ft
Est. Value
About This Home
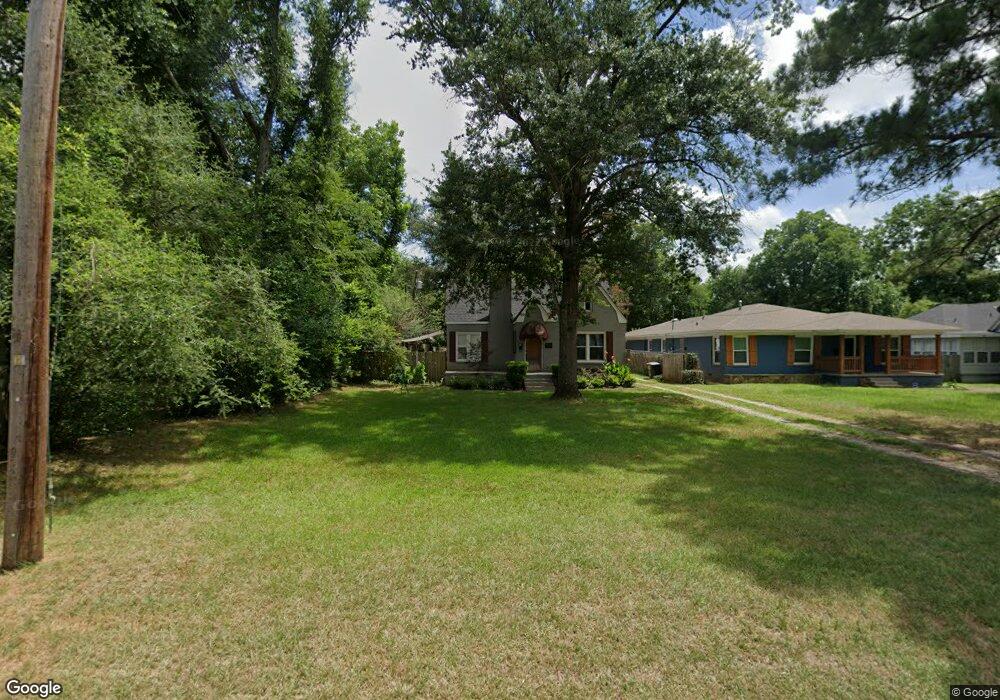
This home is located at 925 Troup Hwy, Tyler, TX 75701 and is currently estimated at $220,747, approximately $145 per square foot. 925 Troup Hwy is a home located in Smith County with nearby schools including Woods Elementary School, Hubbard Middle School, and Tyler Legacy High School.
Ownership History
Date
Name
Owned For
Owner Type
Purchase Details
Closed on
May 4, 2018
Sold by
Tylertex Holdings Llc
Bought by
Boone Richard G and Erbaugh Chasity
Current Estimated Value
Home Financials for this Owner
Home Financials are based on the most recent Mortgage that was taken out on this home.
Original Mortgage
$140,650
Outstanding Balance
$120,725
Interest Rate
4.45%
Mortgage Type
New Conventional
Estimated Equity
$100,022
Purchase Details
Closed on
May 12, 2017
Sold by
Guiter Daniel L and Guiter Noella
Bought by
Shipley Robert
Home Financials for this Owner
Home Financials are based on the most recent Mortgage that was taken out on this home.
Original Mortgage
$76,900
Interest Rate
4.1%
Mortgage Type
Purchase Money Mortgage
Purchase Details
Closed on
Mar 31, 2010
Sold by
Theriot David
Bought by
Guiter Daniel L and Guiter Noelia
Create a Home Valuation Report for This Property
The Home Valuation Report is an in-depth analysis detailing your home's value as well as a comparison with similar homes in the area
Home Values in the Area
Average Home Value in this Area
Purchase History
| Date | Buyer | Sale Price | Title Company |
|---|---|---|---|
| Boone Richard G | -- | None Available | |
| Shipley Robert | -- | None Available | |
| Guiter Daniel L | -- | None Available |
Source: Public Records
Mortgage History
| Date | Status | Borrower | Loan Amount |
|---|---|---|---|
| Open | Boone Richard G | $140,650 | |
| Previous Owner | Shipley Robert | $76,900 |
Source: Public Records
Tax History Compared to Growth
Tax History
| Year | Tax Paid | Tax Assessment Tax Assessment Total Assessment is a certain percentage of the fair market value that is determined by local assessors to be the total taxable value of land and additions on the property. | Land | Improvement |
|---|---|---|---|---|
| 2025 | $1,246 | $245,762 | $67,410 | $178,352 |
| 2024 | $1,246 | $129,538 | $18,650 | $180,665 |
| 2023 | $2,053 | $168,071 | $18,650 | $149,421 |
| 2022 | $2,097 | $120,709 | $12,433 | $108,276 |
| 2021 | $2,042 | $97,324 | $12,433 | $84,891 |
| 2020 | $2,083 | $97,324 | $12,433 | $84,891 |
| 2019 | $1,963 | $89,755 | $9,660 | $80,095 |
| 2018 | $1,863 | $85,664 | $9,660 | $76,004 |
| 2017 | $1,829 | $85,664 | $9,660 | $76,004 |
| 2016 | $1,792 | $83,951 | $9,660 | $74,291 |
| 2015 | $1,713 | $83,350 | $9,660 | $73,690 |
| 2014 | $1,713 | $80,604 | $9,660 | $70,944 |
Source: Public Records
Map
Nearby Homes
- 2315 Homestead Ln
- 2215 Homestead Ln
- 2210 Homestead Ln
- 2313 Dietz Ln
- 2431 Homestead Ln
- 2413 Dietz Ln
- 2319 Pollard Dr
- 2425 Dietz Ln
- 2322 Dietz Ln
- 2521 Pounds Ave
- 2410 Dietz Ln
- 2438 Dietz Ln
- 1102 S Peach Ave S
- 515 & 517 Charnwood St
- 3922 & 3928 McDonald Rd
- 2110 Belmont Dr
- 1931 S Wiley Ave
- 1300 Sunset Dr
- 1322 Sunset Dr
- 2108 S Wall Ave
- 921 Troup Hwy
- 921 Troup Hwy
- 1001 Troup Hwy
- 915 Troup Hwy
- 909 Troup Hwy
- 1011 Troup Hwy
- 930 Troup Hwy
- 914 Troup Hwy
- 932 932 Troup Hwy
- 905 Troup Hwy
- 932 Troup Hwy
- 910 910 Troup Hwy
- 1019 Troup Hwy
- 910 Troup Hwy
- 2303 Waydak Cir
- 2309 Waydak Cir
- 2204 Pollard Dr
- 2204 2204 Pollard
- 1000 Troup Hwy
- 2210 Pollard Dr