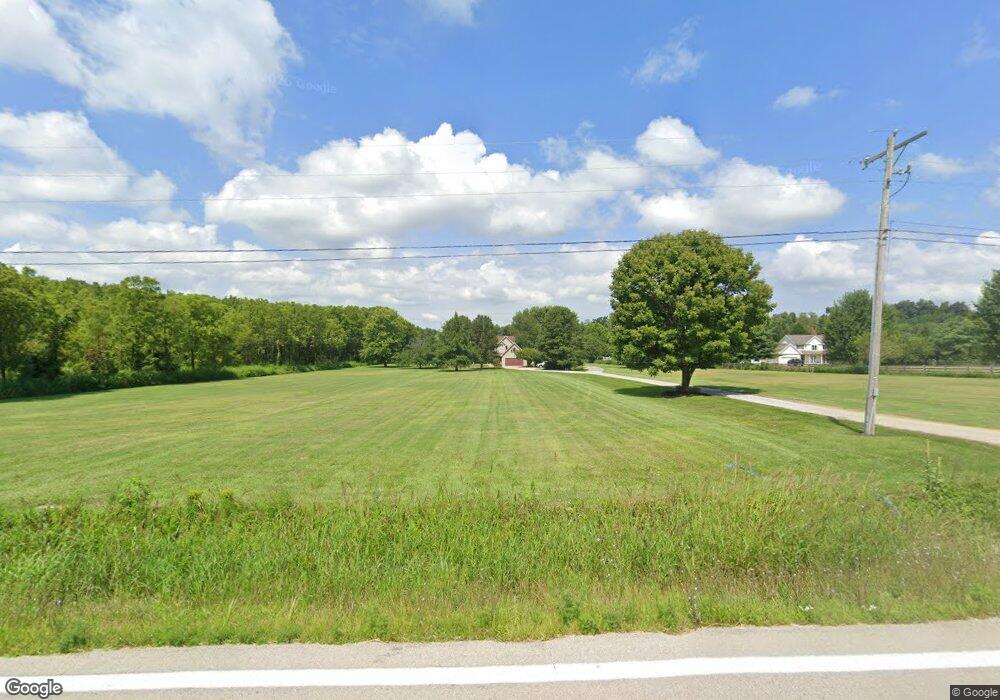
9252 State Route 730 Clarksville, OH 45113
Estimated Value: $479,000 - $544,000
4
Beds
3
Baths
2,416
Sq Ft
$209/Sq Ft
Est. Value
About This Home
This home is located at 9252 State Route 730, Clarksville, OH 45113 and is currently estimated at $504,776, approximately $208 per square foot. 9252 State Route 730 is a home located in Clinton County with nearby schools including Clinton-Massie Elementary School, Clinton-Massie Middle School, and Clinton-Massie High School.
Ownership History
Date
Name
Owned For
Owner Type
Purchase Details
Closed on
Dec 7, 2012
Sold by
Fannie Mae
Bought by
Hathaway Steven and Hathaway Melinda
Current Estimated Value
Purchase Details
Closed on
May 15, 2012
Sold by
Fannie Mae
Bought by
Hathaway Steven and Hathaway Melinda
Purchase Details
Closed on
Mar 12, 2012
Sold by
Ralph D Fizer Jr Sheriff Of Clinton Cou
Bought by
Federal National Mortgage Association
Purchase Details
Closed on
Oct 17, 2008
Sold by
Strouth Michael K and Strouth Carolyn R
Bought by
Courson David L and Courson Kathleen J
Home Financials for this Owner
Home Financials are based on the most recent Mortgage that was taken out on this home.
Original Mortgage
$190,000
Interest Rate
5.73%
Purchase Details
Closed on
Jul 7, 1998
Sold by
Bryant Jerry
Bought by
Strouth Michael K
Purchase Details
Closed on
Nov 14, 1997
Bought by
Phou Tes
Create a Home Valuation Report for This Property
The Home Valuation Report is an in-depth analysis detailing your home's value as well as a comparison with similar homes in the area
Home Values in the Area
Average Home Value in this Area
Purchase History
| Date | Buyer | Sale Price | Title Company |
|---|---|---|---|
| Hathaway Steven | -- | -- | |
| Hathaway Steven | -- | -- | |
| Federal National Mortgage Association | -- | -- | |
| Courson David L | -- | -- | |
| Strouth Michael K | $169,000 | -- | |
| Phou Tes | -- | -- |
Source: Public Records
Mortgage History
| Date | Status | Borrower | Loan Amount |
|---|---|---|---|
| Previous Owner | Courson David L | $190,000 |
Source: Public Records
Tax History Compared to Growth
Tax History
| Year | Tax Paid | Tax Assessment Tax Assessment Total Assessment is a certain percentage of the fair market value that is determined by local assessors to be the total taxable value of land and additions on the property. | Land | Improvement |
|---|---|---|---|---|
| 2024 | $4,135 | $122,120 | $23,590 | $98,530 |
| 2023 | $4,135 | $122,120 | $23,590 | $98,530 |
| 2022 | $3,969 | $108,320 | $10,360 | $97,960 |
| 2021 | $3,972 | $108,320 | $10,360 | $97,960 |
| 2020 | $3,901 | $108,320 | $10,360 | $97,960 |
| 2019 | $3,034 | $85,850 | $11,980 | $73,870 |
| 2018 | $3,069 | $85,850 | $11,980 | $73,870 |
| 2017 | $2,988 | $85,850 | $11,980 | $73,870 |
| 2016 | $2,367 | $67,760 | $13,370 | $54,390 |
| 2015 | $2,484 | $67,760 | $13,370 | $54,390 |
| 2013 | $2,483 | $66,750 | $13,370 | $53,380 |
Source: Public Records
Map
Nearby Homes
- 9132 St Rt 730
- 279 Frances Dr
- 1623 Reeder Rd
- 1727 Reeder Rd
- 0 Old State Rd Unit 1849352
- 1163 Pratt Rd
- 1211 Pratt Rd
- 2211 Reeder Rd
- 582 Nauvoo Rd
- 963 Pratt Rd
- 1043 Cowan Creek Rd
- 9356 Ohio 350
- 420 Kensington Dr
- 181 Water St
- 185 Water St
- 852 State Route 132
- 104 Linton Ave
- 4255 Nicholson Rd
- 1850 Irvin Rd
- 100ac Irvin Rd
- 9252 St Rt 730
- 9224 Ohio 730
- 9224 St Rt 730
- 9224 State Route 730
- 9132 Ohio 730
- 9132 State Route 730
- 9317 State Route 730
- 9189 State Route 730
- 9345 State Route 730
- 9050 State Route 730
- 9408 State Route 730
- 9408 State Route 730
- 9345 Ohio 730
- 8996 State Route 730
- 8996 State Route 730
- 9047 State Route 730
- 9047 State Route 730
- 8996 Ohio 730
- 9033 State Route 730
- 35 Reeder Rd