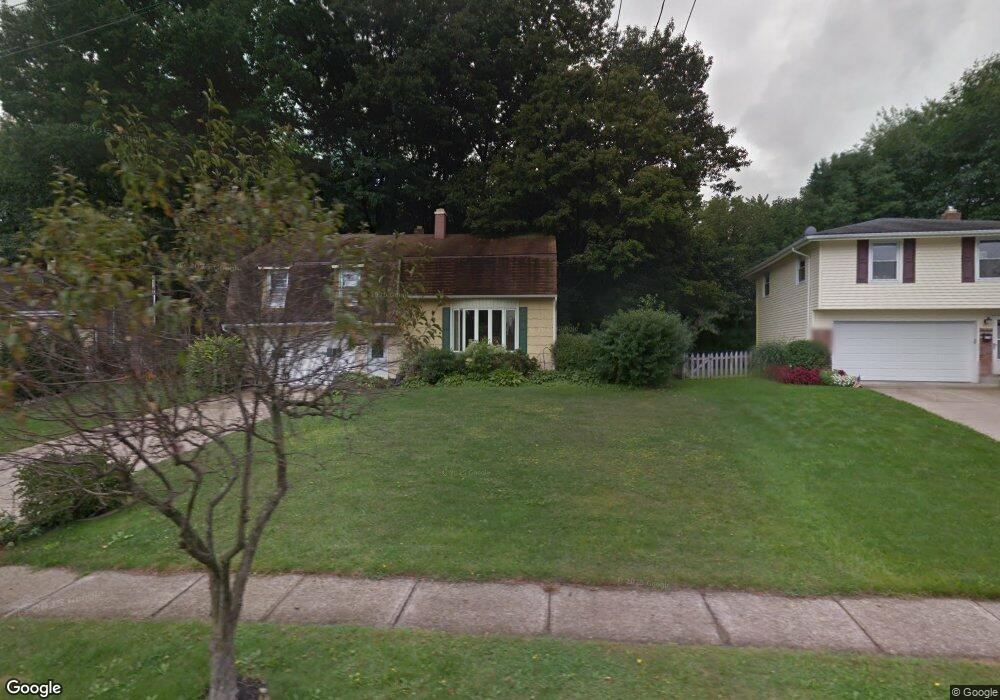
9255 Gettysburg Dr Twinsburg, OH 44087
Estimated Value: $298,000 - $327,000
4
Beds
2
Baths
1,104
Sq Ft
$285/Sq Ft
Est. Value
About This Home
This home is located at 9255 Gettysburg Dr, Twinsburg, OH 44087 and is currently estimated at $314,526, approximately $284 per square foot. 9255 Gettysburg Dr is a home located in Summit County with nearby schools including Wilcox Primary School, Dodge Intermediate School, and Samuel Bissell Elementary School.
Ownership History
Date
Name
Owned For
Owner Type
Purchase Details
Closed on
Oct 31, 2003
Sold by
Stanley Craig and Stanley Sandra J
Bought by
Stanley Craig and Stanley Sandra J
Current Estimated Value
Home Financials for this Owner
Home Financials are based on the most recent Mortgage that was taken out on this home.
Original Mortgage
$162,000
Outstanding Balance
$97,785
Interest Rate
10.62%
Mortgage Type
Purchase Money Mortgage
Estimated Equity
$216,741
Purchase Details
Closed on
Mar 11, 1999
Sold by
Ward Gale L and Grau Gale L
Bought by
Stanley Craig
Home Financials for this Owner
Home Financials are based on the most recent Mortgage that was taken out on this home.
Original Mortgage
$137,750
Interest Rate
6.78%
Create a Home Valuation Report for This Property
The Home Valuation Report is an in-depth analysis detailing your home's value as well as a comparison with similar homes in the area
Home Values in the Area
Average Home Value in this Area
Purchase History
| Date | Buyer | Sale Price | Title Company |
|---|---|---|---|
| Stanley Craig | -- | Secure Title Of Ohio | |
| Stanley Craig | $145,000 | Quality Title Agency Inc |
Source: Public Records
Mortgage History
| Date | Status | Borrower | Loan Amount |
|---|---|---|---|
| Open | Stanley Craig | $162,000 | |
| Closed | Stanley Craig | $137,750 |
Source: Public Records
Tax History Compared to Growth
Tax History
| Year | Tax Paid | Tax Assessment Tax Assessment Total Assessment is a certain percentage of the fair market value that is determined by local assessors to be the total taxable value of land and additions on the property. | Land | Improvement |
|---|---|---|---|---|
| 2025 | $4,345 | $90,262 | $15,372 | $74,890 |
| 2024 | $4,345 | $90,262 | $15,372 | $74,890 |
| 2023 | $4,345 | $90,262 | $15,372 | $74,890 |
| 2022 | $3,492 | $64,709 | $10,980 | $53,729 |
| 2021 | $3,508 | $64,709 | $10,980 | $53,729 |
| 2020 | $3,403 | $64,710 | $10,980 | $53,730 |
| 2019 | $3,016 | $53,610 | $10,980 | $42,630 |
| 2018 | $3,163 | $53,610 | $10,980 | $42,630 |
| 2017 | $2,694 | $53,610 | $10,980 | $42,630 |
| 2016 | $2,931 | $50,370 | $10,980 | $39,390 |
| 2015 | $2,694 | $50,370 | $10,980 | $39,390 |
| 2014 | $2,689 | $50,370 | $10,980 | $39,390 |
| 2013 | $2,918 | $54,710 | $10,980 | $43,730 |
Source: Public Records
Map
Nearby Homes
- 9387 Hyde Park Dr
- 9391 Monticello Dr
- 2092 Holmes Dr
- 9452 Fairfield Dr
- 0 Chamberlin Rd Unit 5171385
- 9232 Chamberlin Rd
- 1632 Strauss Ln
- 1780 Rolling Hills Dr Unit B
- 9537 Ridge Ct Unit 7
- 9618 E Idlewood Dr
- 1533 Bradford Dr
- SL 1 Chamberlin Rd
- 34 E Aurora Rd
- 1816 Westwood Dr
- SL 2 Chamberlin Rd
- 2560 Edgebrook Crossing Unit 74
- 1621 Ridgewood Ct
- VL Shepard Rd
- V/L- Eton St
- 10044 Serene Ct
- 9261 Gettysburg Dr
- 9245 Gettysburg Dr
- 9269 Gettysburg Dr
- 9235 Gettysburg Dr
- 9246 Gettysburg Dr
- 9277 Gettysburg Dr
- 9256 Gettysburg Dr
- 9227 Gettysburg Dr
- 9264 Gettysburg Dr
- 9234 Gettysburg Dr
- 9274 Gettysburg Dr
- 9285 Gettysburg Dr
- 9219 Gettysburg Dr
- 9220 Gettysburg Dr
- 9316 Monticello Dr
- 9307 Fairfield Dr
- 9288 Gettysburg Dr
- 9293 Gettysburg Dr
- 9211 Gettysburg Dr
- 9315 Fairfield Dr