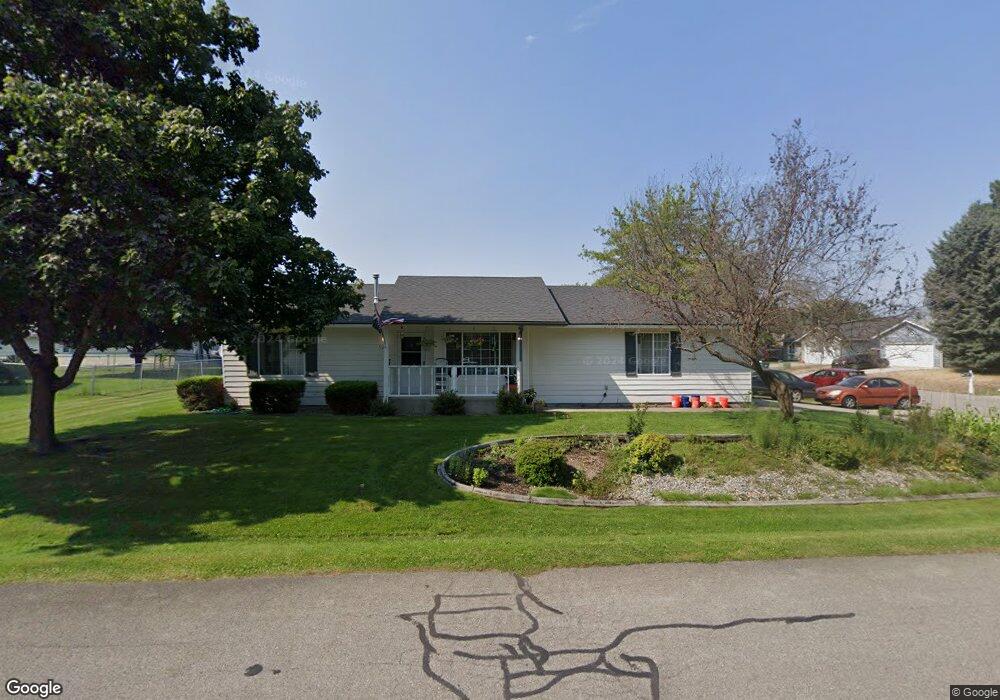
9255 N Kayla Ct Hayden, ID 83835
Avondale NeighborhoodEstimated Value: $509,000 - $563,000
5
Beds
3
Baths
1,796
Sq Ft
$297/Sq Ft
Est. Value
About This Home
This home is located at 9255 N Kayla Ct, Hayden, ID 83835 and is currently estimated at $533,417, approximately $297 per square foot. 9255 N Kayla Ct is a home located in Kootenai County with nearby schools including Hayden Meadows Elementary School, Canfield Middle School, and Coeur d'Alene High School.
Ownership History
Date
Name
Owned For
Owner Type
Purchase Details
Closed on
Aug 1, 2021
Sold by
Smith Terry Lynn and Smith Nancy Ellen
Bought by
Eichholtz Heather Lynn and Eichholtz Frederick Warren
Current Estimated Value
Home Financials for this Owner
Home Financials are based on the most recent Mortgage that was taken out on this home.
Original Mortgage
$359,251
Outstanding Balance
$325,965
Interest Rate
2.9%
Mortgage Type
New Conventional
Estimated Equity
$207,452
Purchase Details
Closed on
Aug 1, 2007
Sold by
Peckham Barbara E
Bought by
Smith Terry Lynn and Smith Nancy Ellen
Home Financials for this Owner
Home Financials are based on the most recent Mortgage that was taken out on this home.
Original Mortgage
$80,000
Interest Rate
6.65%
Mortgage Type
New Conventional
Purchase Details
Closed on
Jun 28, 2005
Sold by
Lawson William F and Lawson Karen D
Bought by
Peckham Barbara E
Create a Home Valuation Report for This Property
The Home Valuation Report is an in-depth analysis detailing your home's value as well as a comparison with similar homes in the area
Home Values in the Area
Average Home Value in this Area
Purchase History
| Date | Buyer | Sale Price | Title Company |
|---|---|---|---|
| Eichholtz Heather Lynn | -- | Titleone Boise | |
| Smith Terry Lynn | -- | -- | |
| Peckham Barbara E | -- | -- |
Source: Public Records
Mortgage History
| Date | Status | Borrower | Loan Amount |
|---|---|---|---|
| Open | Eichholtz Heather Lynn | $359,251 | |
| Previous Owner | Smith Terry Lynn | $80,000 |
Source: Public Records
Tax History Compared to Growth
Tax History
| Year | Tax Paid | Tax Assessment Tax Assessment Total Assessment is a certain percentage of the fair market value that is determined by local assessors to be the total taxable value of land and additions on the property. | Land | Improvement |
|---|---|---|---|---|
| 2025 | $2,376 | $535,458 | $190,000 | $345,458 |
| 2024 | $2,376 | $486,780 | $175,000 | $311,780 |
| 2023 | $2,376 | $512,400 | $180,000 | $332,400 |
| 2022 | $2,668 | $593,438 | $200,000 | $393,438 |
| 2021 | $2,493 | $339,196 | $120,000 | $219,196 |
| 2020 | $2,464 | $294,872 | $97,750 | $197,122 |
| 2019 | $2,437 | $267,991 | $85,000 | $182,991 |
| 2018 | $2,381 | $233,107 | $85,000 | $148,107 |
| 2017 | $2,474 | $226,917 | $49,500 | $177,417 |
| 2016 | $2,353 | $206,397 | $49,500 | $156,897 |
| 2015 | $1,100 | $187,587 | $45,000 | $142,587 |
| 2013 | $1,026 | $162,450 | $45,000 | $117,450 |
Source: Public Records
Map
Nearby Homes
- 9384 N Baack St
- 9462 N Baack St
- 8393 N Cloverleaf Dr
- 623 E Maple Place
- 536 E Cloverleaf Dr
- 8698 N Woodvine Dr
- 164 W Hilgren Ave
- 9345 N Secretariat Ln
- 452 W Hayden Ave
- 9221 N Starr Loop
- 8419 N Cloverleaf Dr
- 8570 N Hayden Pines Way
- 8603 N Hayden Pines Way
- 9706 N Shaw St
- 8776 N Wayne Dr
- 8562 N Audubon Dr
- 985 E Loch Lomond Ct
- 8318 N Village Dr Unit 2
- 1268 E Woodstone Ct
- 8351 N Audubon Dr
- 228 E Ryan Dr
- 204 E Ryan Dr
- 0 N Kayla Ct
- 229 E Orchard Ave
- 202 E Ryan Dr
- 203 E Orchard Ave
- 9224 N Kayla Ct
- 9266 N Kayla Ct
- 9307 N Kayla Ct
- 201 E Orchard Ave
- 9286 N Kayla Ct
- 215 E Ryan Dr
- 9220 N Kayla Ct
- 176 E Ryan Dr
- 195 E Ryan Dr
- 177 Orchard Ave
- 9312 N Kayla Ct
- 175 E Orchard Ave
- 9333 N Kayla Ct
- 175 E Ryan Dr