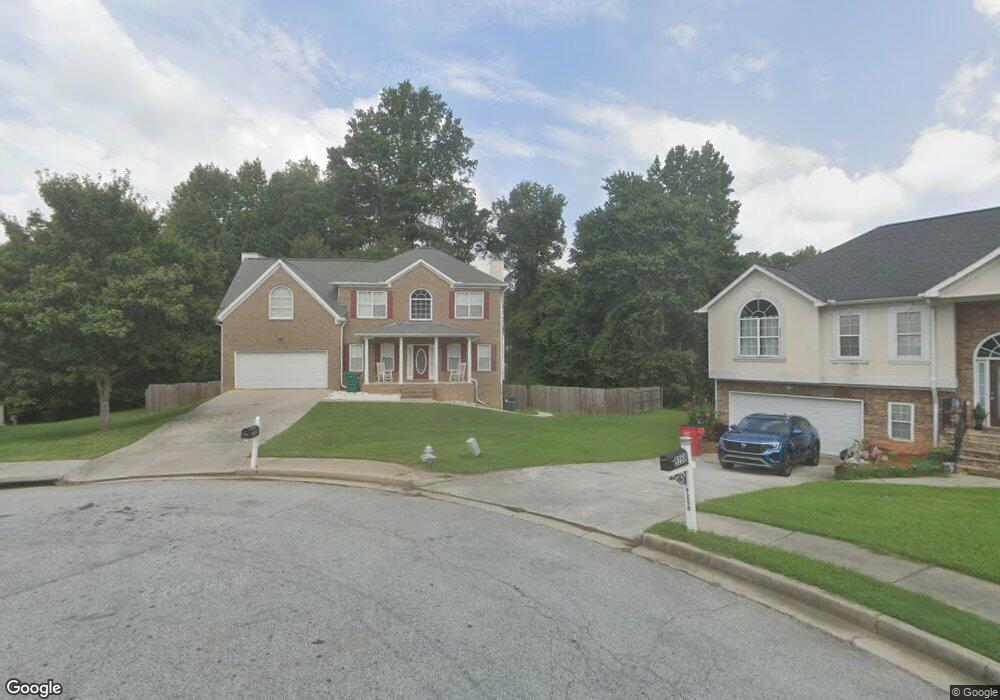
9257 Crimson Ridge Ct Jonesboro, GA 30238
Estimated Value: $282,000 - $348,000
4
Beds
3
Baths
2,200
Sq Ft
$139/Sq Ft
Est. Value
About This Home
This home is located at 9257 Crimson Ridge Ct, Jonesboro, GA 30238 and is currently estimated at $305,975, approximately $139 per square foot. 9257 Crimson Ridge Ct is a home located in Clayton County with nearby schools including Brown Elementary School, Mundys Mill Middle School, and Mundy's Mill High School.
Ownership History
Date
Name
Owned For
Owner Type
Purchase Details
Closed on
Jul 14, 2016
Sold by
Pennymac Loa Trust 2011 & Npl1
Bought by
Sams Octavis
Current Estimated Value
Home Financials for this Owner
Home Financials are based on the most recent Mortgage that was taken out on this home.
Original Mortgage
$156,000
Outstanding Balance
$124,374
Interest Rate
3.54%
Mortgage Type
VA
Estimated Equity
$181,601
Purchase Details
Closed on
Jul 7, 2015
Sold by
Finkley Fernita R
Bought by
Wilmington Savings Fund Society Fsb
Purchase Details
Closed on
Sep 16, 2002
Sold by
Tara Const Co
Bought by
Finkley Fernita
Home Financials for this Owner
Home Financials are based on the most recent Mortgage that was taken out on this home.
Original Mortgage
$172,474
Interest Rate
6.3%
Mortgage Type
New Conventional
Create a Home Valuation Report for This Property
The Home Valuation Report is an in-depth analysis detailing your home's value as well as a comparison with similar homes in the area
Home Values in the Area
Average Home Value in this Area
Purchase History
| Date | Buyer | Sale Price | Title Company |
|---|---|---|---|
| Sams Octavis | $156,000 | -- | |
| Wilmington Savings Fund Society Fsb | -- | -- | |
| Finkley Fernita | $181,600 | -- |
Source: Public Records
Mortgage History
| Date | Status | Borrower | Loan Amount |
|---|---|---|---|
| Open | Sams Octavis | $156,000 | |
| Previous Owner | Finkley Fernita | $172,474 |
Source: Public Records
Tax History Compared to Growth
Tax History
| Year | Tax Paid | Tax Assessment Tax Assessment Total Assessment is a certain percentage of the fair market value that is determined by local assessors to be the total taxable value of land and additions on the property. | Land | Improvement |
|---|---|---|---|---|
| 2024 | $38 | $115,720 | $11,200 | $104,520 |
| 2023 | $4,178 | $115,720 | $11,200 | $104,520 |
| 2022 | $38 | $100,280 | $11,200 | $89,080 |
| 2021 | $38 | $69,760 | $11,200 | $58,560 |
| 2020 | $38 | $71,675 | $11,200 | $60,475 |
| 2019 | $2,348 | $66,914 | $12,000 | $54,914 |
| 2018 | $1,951 | $57,118 | $12,000 | $45,118 |
| 2017 | $1,994 | $58,060 | $12,000 | $46,060 |
| 2016 | $2,310 | $55,840 | $12,000 | $43,840 |
| 2015 | $1,891 | $0 | $0 | $0 |
| 2014 | $1,772 | $53,573 | $12,000 | $41,573 |
Source: Public Records
Map
Nearby Homes
- 692 Sedgwick Dr
- 445 Westside Dr
- 532 Flint Ridge Ct Unit 1
- 439 Windy Ct
- 443 Windy Ct
- 447 Windy Ct
- 770 Four Winds Ln
- 631 Crestmont Ct
- 9579 Fayetteville Rd
- 9579 Highway 54 W
- 755 Dunaire Way
- 9000 Cornell Dr
- 9066 Bob Jackson Dr
- 119 Dixboro Dr
- 9381 Windward Ct
- 53 Diana Ct
- 49 Diana Ct
- 151 Andover Dr
- 8857 Woodridge Ct
- 0 Highway 54 Unit 10613856
- 9258 Crimson Ridge Ct
- 9261 Crimson Ridge Ct Unit 9
- 9261 Crimson Ridge Ct
- 0 Crimson Ridge Ct
- 9250 Crimson Ridge Ct
- 9267 Crimson Ridge Ct
- 9254 Willow Tree Ct
- 9262 Willow Tree Ct
- 532 Crimson Ridge Dr Unit 5
- 532 Crimson Ridge Dr
- 9250 Willow Tree Ct
- 9275 Crimson Ridge Ct
- 544 Crimson Ridge Dr
- 9266 Willow Tree Ct
- 503 Cypress Estates Cove
- 511 Cypress Estates Cove
- 511 Cypress Estates Cove Unit /24
- 556 Crimson Ridge Dr
- 273 Willows Dr Dr
- 495 Cypress Estates Cove