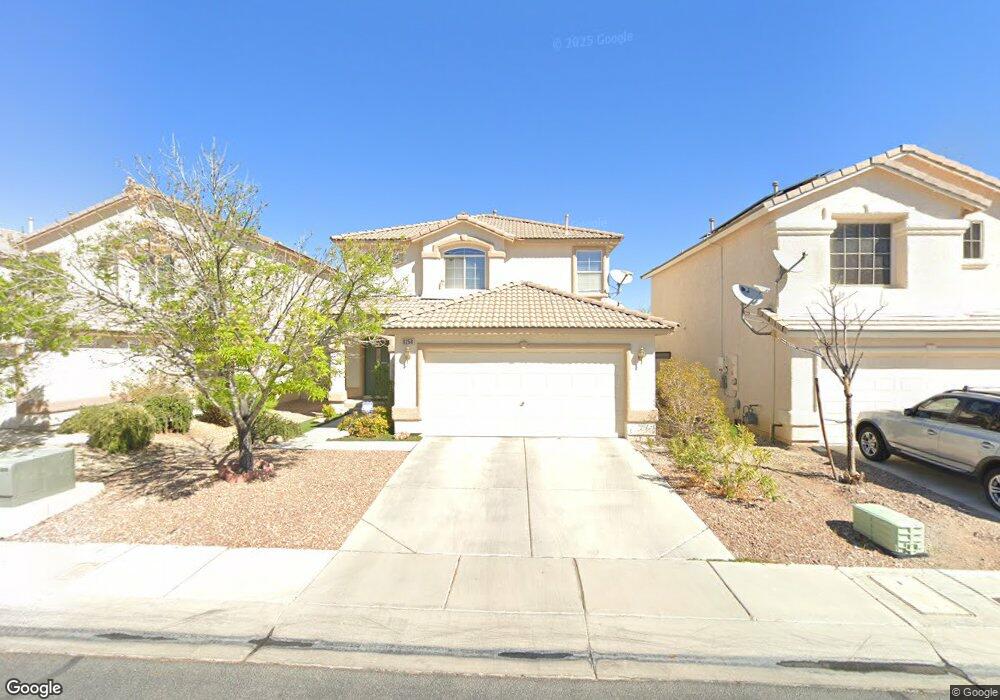
9258 Ansley Ct Unit 1 Las Vegas, NV 89148
Estimated Value: $399,946 - $415,000
3
Beds
3
Baths
1,419
Sq Ft
$287/Sq Ft
Est. Value
About This Home
This home is located at 9258 Ansley Ct Unit 1, Las Vegas, NV 89148 and is currently estimated at $407,237, approximately $286 per square foot. 9258 Ansley Ct Unit 1 is a home located in Clark County with nearby schools including Wayne N. Tanaka Elementary School, Wilbur & Theresa Faiss Middle School, and Sierra Vista High School.
Ownership History
Date
Name
Owned For
Owner Type
Purchase Details
Closed on
Jul 16, 2012
Sold by
Fabro Mario
Bought by
Fabro Mario and Fabro Vivien Hazel
Current Estimated Value
Purchase Details
Closed on
Nov 18, 2010
Sold by
Fabro Vivien Hazel R
Bought by
Fabro Mario
Home Financials for this Owner
Home Financials are based on the most recent Mortgage that was taken out on this home.
Original Mortgage
$91,000
Outstanding Balance
$59,918
Interest Rate
4.23%
Mortgage Type
New Conventional
Estimated Equity
$347,319
Purchase Details
Closed on
Mar 31, 2010
Sold by
Leckey Thomas
Bought by
Fannie Mae
Purchase Details
Closed on
Feb 15, 2005
Sold by
Leckey David R
Bought by
Leckey Thomas
Create a Home Valuation Report for This Property
The Home Valuation Report is an in-depth analysis detailing your home's value as well as a comparison with similar homes in the area
Home Values in the Area
Average Home Value in this Area
Purchase History
| Date | Buyer | Sale Price | Title Company |
|---|---|---|---|
| Fabro Mario | -- | None Available | |
| Fabro Mario | -- | Lawyers Title Of Nevada Hen | |
| Fabro Mario | $120,000 | Lawyers Title Of Nevada Hen | |
| Fannie Mae | $255,229 | Lawyers Title Of Nevada Cen | |
| Leckey Thomas | -- | -- | |
| Leckey David R | -- | -- |
Source: Public Records
Mortgage History
| Date | Status | Borrower | Loan Amount |
|---|---|---|---|
| Open | Fabro Mario | $91,000 |
Source: Public Records
Tax History Compared to Growth
Tax History
| Year | Tax Paid | Tax Assessment Tax Assessment Total Assessment is a certain percentage of the fair market value that is determined by local assessors to be the total taxable value of land and additions on the property. | Land | Improvement |
|---|---|---|---|---|
| 2025 | $1,592 | $100,204 | $38,500 | $61,704 |
| 2024 | $1,546 | $100,204 | $38,500 | $61,704 |
| 2023 | $1,546 | $91,505 | $33,250 | $58,255 |
| 2022 | $1,501 | $81,113 | $28,000 | $53,113 |
| 2021 | $1,457 | $75,036 | $24,500 | $50,536 |
| 2020 | $1,412 | $73,540 | $23,450 | $50,090 |
| 2019 | $1,371 | $70,261 | $21,000 | $49,261 |
| 2018 | $1,331 | $63,667 | $16,450 | $47,217 |
| 2017 | $1,864 | $63,562 | $15,750 | $47,812 |
| 2016 | $1,261 | $56,238 | $11,900 | $44,338 |
| 2015 | $1,258 | $48,913 | $10,850 | $38,063 |
| 2014 | $1,221 | $40,392 | $6,300 | $34,092 |
Source: Public Records
Map
Nearby Homes
- 9249 Shellmont Ct
- 9299 Adamshurst Ave
- 7011 Azure Beach St
- 9272 Keaton Ave
- 7264 Morrison St
- 0 Fort Apache Unit 2719841
- 9050 W Warm Springs Rd Unit 1164
- 9050 W Warm Springs Rd Unit 1092
- 9050 W Warm Springs Rd Unit 2099
- 7325 Ringquist St
- 9330 W Maule Ave Unit 226
- 9330 W Maule Ave Unit 212
- 9119 Glennon Ave
- 9123 Hilverson Ave
- 9186 Berstler Ave Unit 1A
- 9229 Millikan Ave
- 9557 Belmont Bay Ave
- 9544 Wild Valley Ave
- 6884 Stonetrace St
- 8982 Leaping Pad Ct
- 9252 Ansley Ct
- 9246 Ansley Ct
- 9270 Ansley Ct Unit 1
- 9240 Ansley Ct
- 9276 Ansley Ct
- 9259 Ansley Ct
- 9265 Ansley Ct
- 9253 Ansley Ct
- 9282 Ansley Ct Unit 1
- 9271 Ansley Ct
- 9247 Ansley Ct Unit 1
- 9259 Hidden Harbor Ave
- 9253 Hidden Harbor Ave
- 9271 Hidden Harbor Ave
- 9247 Hidden Harbor Ave
- 9277 Ansley Ct
- 9277 Hidden Harbor Ave
- 9241 Ansley Ct
- 9241 Hidden Harbor Ave
- 9288 Ansley Ct