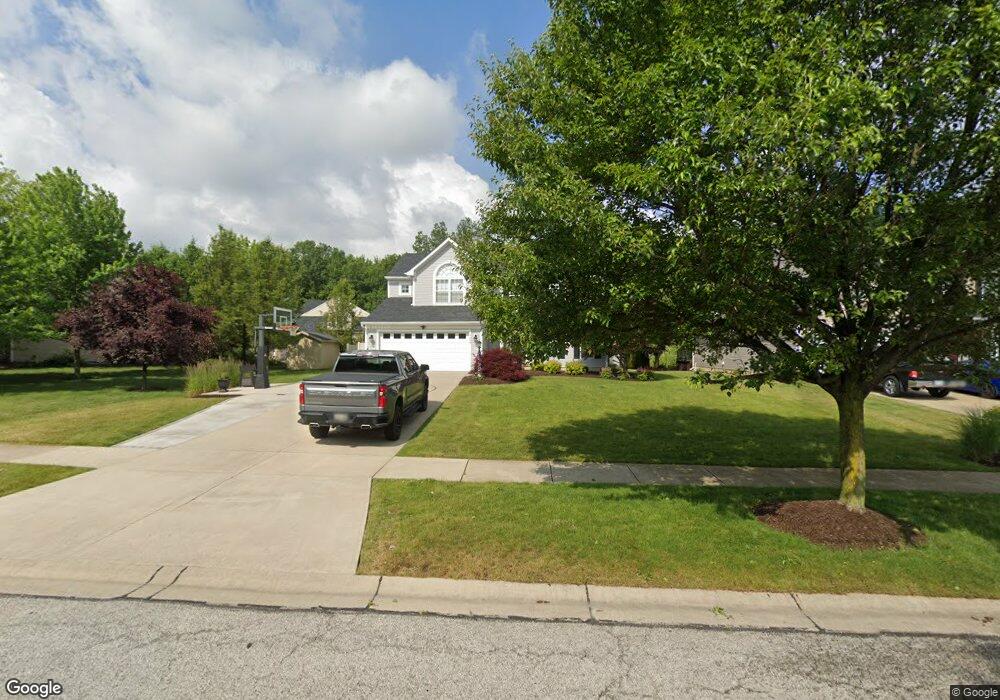
9258 Stonebriar Ln North Ridgeville, OH 44039
Estimated Value: $423,872 - $467,000
4
Beds
3
Baths
2,656
Sq Ft
$166/Sq Ft
Est. Value
About This Home
This home is located at 9258 Stonebriar Ln, North Ridgeville, OH 44039 and is currently estimated at $441,968, approximately $166 per square foot. 9258 Stonebriar Ln is a home located in Lorain County with nearby schools including North Ridgeville Academic Center, Liberty Elementary School, and Ranger High Tech Academy.
Ownership History
Date
Name
Owned For
Owner Type
Purchase Details
Closed on
Apr 5, 2022
Sold by
Faris Sara E and Faris Greg S
Bought by
Faris Greg S and Faris Sara E
Current Estimated Value
Home Financials for this Owner
Home Financials are based on the most recent Mortgage that was taken out on this home.
Original Mortgage
$162,000
Outstanding Balance
$131,496
Interest Rate
3.14%
Mortgage Type
New Conventional
Estimated Equity
$310,472
Purchase Details
Closed on
May 26, 2017
Sold by
Faris Gregory S and Faris Sara E
Bought by
Faris Family Trust
Purchase Details
Closed on
Jan 9, 2007
Sold by
Nvr Inc
Bought by
Faris Greg S and Hamge Sara E
Home Financials for this Owner
Home Financials are based on the most recent Mortgage that was taken out on this home.
Original Mortgage
$242,650
Interest Rate
6.27%
Mortgage Type
Purchase Money Mortgage
Purchase Details
Closed on
May 16, 2006
Sold by
Whitlatch & Co
Bought by
Nvr Inc and Ryan Homes
Create a Home Valuation Report for This Property
The Home Valuation Report is an in-depth analysis detailing your home's value as well as a comparison with similar homes in the area
Home Values in the Area
Average Home Value in this Area
Purchase History
| Date | Buyer | Sale Price | Title Company |
|---|---|---|---|
| Faris Greg S | -- | Fidelity National Title | |
| Faris Family Trust | -- | -- | |
| Faris Greg S | $250,200 | Nvr Title Agency | |
| Nvr Inc | $51,000 | Nvr Title |
Source: Public Records
Mortgage History
| Date | Status | Borrower | Loan Amount |
|---|---|---|---|
| Open | Faris Greg S | $162,000 | |
| Previous Owner | Faris Greg S | $242,650 |
Source: Public Records
Tax History Compared to Growth
Tax History
| Year | Tax Paid | Tax Assessment Tax Assessment Total Assessment is a certain percentage of the fair market value that is determined by local assessors to be the total taxable value of land and additions on the property. | Land | Improvement |
|---|---|---|---|---|
| 2024 | $6,875 | $134,687 | $28,000 | $106,687 |
| 2023 | $6,218 | $107,625 | $25,452 | $82,173 |
| 2022 | $5,582 | $107,625 | $25,452 | $82,173 |
| 2021 | $5,604 | $107,625 | $25,452 | $82,173 |
| 2020 | $4,999 | $88,800 | $21,000 | $67,800 |
| 2019 | $4,990 | $88,800 | $21,000 | $67,800 |
| 2018 | $4,758 | $88,800 | $21,000 | $67,800 |
| 2017 | $4,524 | $74,530 | $15,750 | $58,780 |
| 2016 | $4,594 | $74,530 | $15,750 | $58,780 |
| 2015 | $4,660 | $74,530 | $15,750 | $58,780 |
| 2014 | $4,786 | $74,530 | $15,750 | $58,780 |
| 2013 | $4,833 | $74,530 | $15,750 | $58,780 |
Source: Public Records
Map
Nearby Homes
- 9134 Brian St
- 9130 Katherine St
- 35221 Chestnut Ridge Rd
- 34286 Brookside Ln
- S/L 33 Brookside Ln
- S/L 31 Brookside Ln
- S/L 46 Brookside Ln
- 8863 Riverwood Dr
- 33895 Lorain Rd
- 8665 Gatewood Dr
- 32715 Deerspring Ct
- 34645 Dye Rd
- 9114 Stonegate Cir
- 9113 Riverwood Dr
- 9129 Riverwood Dr
- 37058 Danforth Ct
- 37006 Fairfield Ln Unit A2
- 0 Bagley Rd
- 9307 Calista Dr
- 9339 Calista Dr
- 9246 Stonebriar Ln
- 9336 Stonebriar Ln
- 9234 Stonebriar Ln
- 9354 Stonebriar Ln
- 9257 Stonebriar Ln
- 9245 Stonebriar Ln
- 9269 Stonebriar Ln
- 9222 Stonebriar Ln
- 9366 Stonebriar Ln
- 9233 Stonebriar Ln
- 9281 Stonebriar Ln
- 9221 Stonebriar Ln
- 9329 Stonebriar Ln
- 9293 Stonebriar Ln
- 9341 Stonebriar Ln
- 9206 Stonebriar Ln
- 9365 Stonebriar Ln
- 9317 Stonebriar Ln
- 9209 Stonebriar Ln
- 9353 Stonebriar Ln