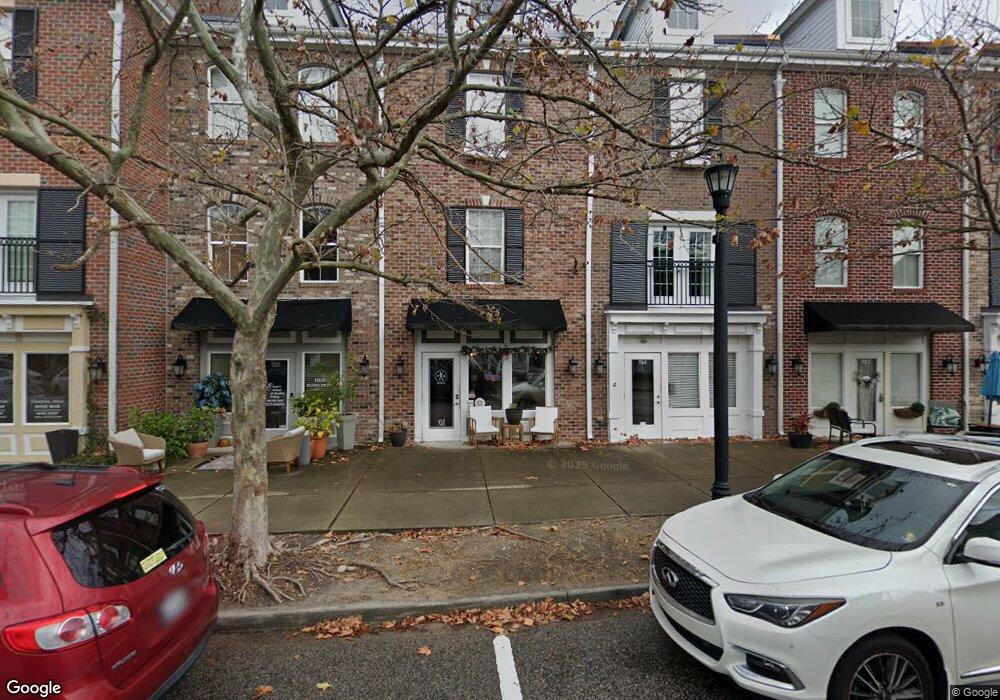
926-A Iris St Myrtle Beach, SC 29577
Market Commons NeighborhoodEstimated Value: $518,169 - $581,000
2
Beds
3
Baths
1,344
Sq Ft
$407/Sq Ft
Est. Value
About This Home
This home is located at 926-A Iris St, Myrtle Beach, SC 29577 and is currently estimated at $547,292, approximately $407 per square foot. 926-A Iris St is a home located in Horry County with nearby schools including Myrtle Beach Child Development Center, Myrtle Beach Primary School, and Myrtle Beach Middle School.
Ownership History
Date
Name
Owned For
Owner Type
Purchase Details
Closed on
Jun 14, 2021
Sold by
Chan Chi K
Bought by
Yost Brian Sanchez and Yost Katrina Marie
Current Estimated Value
Home Financials for this Owner
Home Financials are based on the most recent Mortgage that was taken out on this home.
Original Mortgage
$340,200
Outstanding Balance
$305,312
Interest Rate
2.9%
Mortgage Type
New Conventional
Estimated Equity
$241,980
Purchase Details
Closed on
Feb 13, 2019
Sold by
Market Rental Llc
Bought by
Chan Chi K and Han Eunice
Home Financials for this Owner
Home Financials are based on the most recent Mortgage that was taken out on this home.
Original Mortgage
$228,750
Interest Rate
4.4%
Mortgage Type
New Conventional
Purchase Details
Closed on
Nov 12, 2012
Sold by
Pickering Alice J
Bought by
Market Rental Llc
Purchase Details
Closed on
Feb 3, 2009
Sold by
Market Commons Townhomes Inc
Bought by
Pickering Alice J
Purchase Details
Closed on
Oct 29, 2007
Sold by
Luk Mb2 Llc
Bought by
Market Commons Townhomes Inc
Create a Home Valuation Report for This Property
The Home Valuation Report is an in-depth analysis detailing your home's value as well as a comparison with similar homes in the area
Home Values in the Area
Average Home Value in this Area
Purchase History
| Date | Buyer | Sale Price | Title Company |
|---|---|---|---|
| Yost Brian Sanchez | $378,000 | -- | |
| Chan Chi K | $305,000 | -- | |
| Market Rental Llc | -- | -- | |
| Pickering Alice J | $385,000 | -- | |
| Market Commons Townhomes Inc | $600,000 | None Available |
Source: Public Records
Mortgage History
| Date | Status | Borrower | Loan Amount |
|---|---|---|---|
| Open | Yost Brian Sanchez | $340,200 | |
| Previous Owner | Chan Chi K | $228,750 |
Source: Public Records
Tax History
| Year | Tax Paid | Tax Assessment Tax Assessment Total Assessment is a certain percentage of the fair market value that is determined by local assessors to be the total taxable value of land and additions on the property. | Land | Improvement |
|---|---|---|---|---|
| 2025 | $6,533 | $0 | $0 | $0 |
| 2024 | $6,533 | $37,270 | $8,922 | $28,348 |
| 2023 | $6,533 | $19,312 | $7,138 | $12,174 |
| 2021 | $6,028 | $19,312 | $7,138 | $12,174 |
| 2020 | $4,976 | $19,312 | $7,138 | $12,174 |
| 2019 | $5,440 | $22,786 | $7,138 | $15,648 |
| 2018 | $0 | $19,210 | $7,138 | $12,072 |
| 2017 | $4,826 | $19,210 | $7,138 | $12,072 |
| 2016 | -- | $19,210 | $7,138 | $12,072 |
| 2015 | $4,771 | $19,210 | $7,138 | $12,072 |
| 2014 | $4,639 | $19,210 | $7,138 | $12,072 |
Source: Public Records
Map
Nearby Homes
- 945 Rosencrans Ln Unit 945-D
- 857 Iris St Unit C
- 2931 Howard Ave Unit C
- 2931 Howard Ave Unit A
- 2931 Howard Ave Unit B
- 855 Hall Ln Unit D
- 2790 Cook Cir Unit C
- 2790 Cook Cir Unit D
- 847 Iris St Unit A
- 965 Hackler St Unit E
- 965 Hackler St Unit D
- 2800 Cook Cir Unit C
- 2800 Cook Cir Unit B
- 2800 Cook Cir
- 976 Farrow Pkwy Unit C
- 976 Farrow Pkwy Unit B
- 976 Farrow Pkwy
- 976 Farrow Pkwy Unit A
- 976 Farrow Pkwy Unit D
- 982 Farrow Pkwy Unit C
- 926 Price Ln Unit C
- 925 Iris St
- 925 Iris St Unit 7
- 925D Iris St Unit 5
- 925 Iris St Unit Market Common
- 925 Iris St Unit 925A The Market Comm
- 925 Iris St Unit C
- 925 Iris St Unit D
- 926 D Iris Unit Market Common
- 926 D Iris Unit Market Common/for le
- 926 D Iris
- 926F Iris St
- 2834C Howard Ave Unit C
- 2834C Howard Ave
- 926e Iris St Unit Ground Floor Only
- 926e Iris St
- 2834 Howard Ave Unit F
- 2834 Howard Ave Unit E
- 2834 Howard Ave Unit G
- 2834 Howard Ave Unit B
Your Personal Tour Guide
Ask me questions while you tour the home.