Estimated Value: $161,000 - $219,530
3
Beds
1
Bath
702
Sq Ft
$254/Sq Ft
Est. Value
About This Home
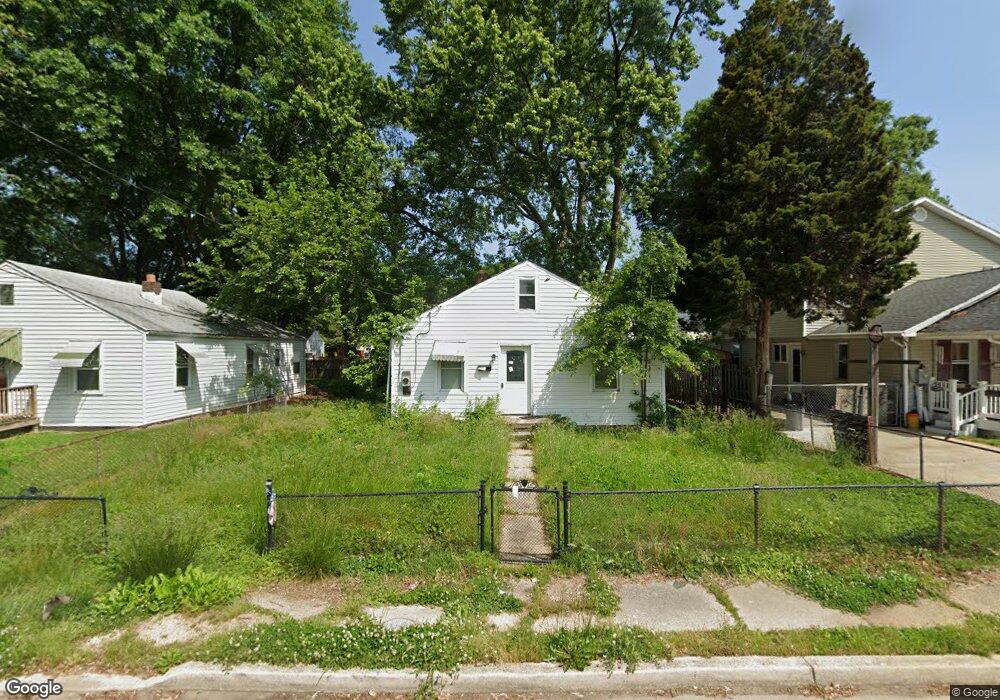
This home is located at 926 Barron Ave, Essex, MD 21221 and is currently estimated at $178,633, approximately $254 per square foot. 926 Barron Ave is a home located in Baltimore County with nearby schools including Sussex Elementary School, Deep Creek Middle, and Chesapeake High School.
Ownership History
Date
Name
Owned For
Owner Type
Purchase Details
Closed on
Mar 15, 2006
Sold by
Frost Rex A
Bought by
Baltimore Investment Company
Current Estimated Value
Home Financials for this Owner
Home Financials are based on the most recent Mortgage that was taken out on this home.
Original Mortgage
$14,911
Outstanding Balance
$8,482
Interest Rate
6.28%
Mortgage Type
Stand Alone Second
Estimated Equity
$170,151
Purchase Details
Closed on
Mar 3, 2006
Sold by
Frost Rex A
Bought by
Baltimore Investment Company
Home Financials for this Owner
Home Financials are based on the most recent Mortgage that was taken out on this home.
Original Mortgage
$14,911
Outstanding Balance
$8,482
Interest Rate
6.28%
Mortgage Type
Stand Alone Second
Estimated Equity
$170,151
Purchase Details
Closed on
Jun 22, 1978
Sold by
Hull Mary Lou
Bought by
Frost Rex A
Create a Home Valuation Report for This Property
The Home Valuation Report is an in-depth analysis detailing your home's value as well as a comparison with similar homes in the area
Home Values in the Area
Average Home Value in this Area
Purchase History
| Date | Buyer | Sale Price | Title Company |
|---|---|---|---|
| Baltimore Investment Company | $60,000 | -- | |
| Baltimore Investment Company | $60,000 | -- | |
| Frost Rex A | $20,000 | -- |
Source: Public Records
Mortgage History
| Date | Status | Borrower | Loan Amount |
|---|---|---|---|
| Open | Baltimore Investment Company | $14,911 | |
| Open | Baltimore Investment Company | $100,000 | |
| Closed | Baltimore Investment Company | $14,911 | |
| Closed | Baltimore Investment Company | $100,000 |
Source: Public Records
Tax History Compared to Growth
Tax History
| Year | Tax Paid | Tax Assessment Tax Assessment Total Assessment is a certain percentage of the fair market value that is determined by local assessors to be the total taxable value of land and additions on the property. | Land | Improvement |
|---|---|---|---|---|
| 2025 | $2,132 | $144,100 | -- | -- |
| 2024 | $2,132 | $137,300 | $0 | $0 |
| 2023 | $2,045 | $130,500 | $61,200 | $69,300 |
| 2022 | $1,975 | $127,433 | $0 | $0 |
| 2021 | $28,974 | $124,367 | $0 | $0 |
| 2020 | $28,974 | $121,300 | $61,200 | $60,100 |
| 2019 | $26,598 | $118,933 | $0 | $0 |
| 2018 | $0 | $116,567 | $0 | $0 |
| 2017 | $2,274 | $114,200 | $0 | $0 |
| 2016 | $2,188 | $113,633 | $0 | $0 |
| 2015 | $2,188 | $113,067 | $0 | $0 |
| 2014 | $2,188 | $112,500 | $0 | $0 |
Source: Public Records
Map
Nearby Homes
- 947 Martin Rd
- 934 Kinwat Ave
- 974 Martin Rd
- 548 S Marlyn Ave
- 344 Maple Ave
- 945 Kinwat Ave
- 821 S Woodlynn Rd
- 15 S Marlyn Ave
- 13 S Marlyn Ave
- 625 New Jersey Ave
- 625 Delaware Ave
- 607 New Jersey Ave
- 19 Pelczar Ave
- 4 Banyan Wood Ct Unit 202
- 609 Virginia Ave
- 2 Cedar Valley Place Unit 204
- 8 Cloverwood Ct Unit 303
- 405 Margaret Ave
- 800 Creek Rd
- 1314 Dorsey Ave