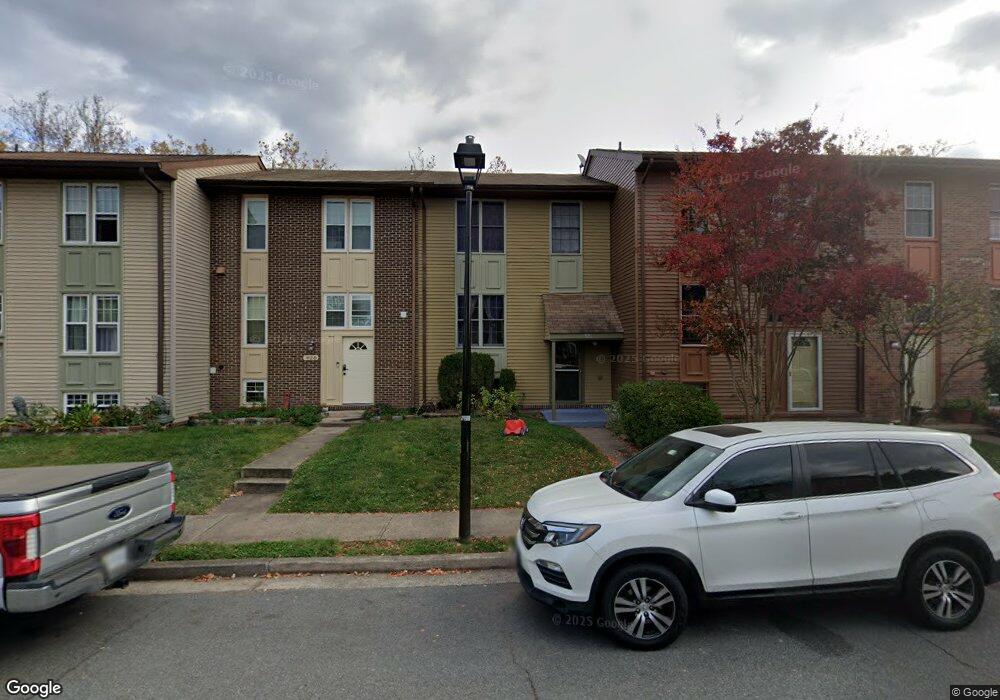
926 Branch Dr Herndon, VA 20170
Estimated Value: $478,000 - $526,000
4
Beds
3
Baths
1,920
Sq Ft
$260/Sq Ft
Est. Value
About This Home
This home is located at 926 Branch Dr, Herndon, VA 20170 and is currently estimated at $499,923, approximately $260 per square foot. 926 Branch Dr is a home located in Fairfax County with nearby schools including Dranesville Elementary, Herndon Middle School, and Herndon High School.
Ownership History
Date
Name
Owned For
Owner Type
Purchase Details
Closed on
Jul 11, 2008
Sold by
Indymac Bank F S B
Bought by
Wu Bingwen and Li,Yanfei
Current Estimated Value
Home Financials for this Owner
Home Financials are based on the most recent Mortgage that was taken out on this home.
Original Mortgage
$118,500
Outstanding Balance
$77,717
Interest Rate
6.4%
Mortgage Type
New Conventional
Estimated Equity
$422,206
Purchase Details
Closed on
Mar 20, 2008
Sold by
Equity Trustees Llc
Bought by
Indymac Bank F S B
Purchase Details
Closed on
Feb 9, 2006
Sold by
Dubo Jose A
Bought by
Nkeutchatang Jossette
Home Financials for this Owner
Home Financials are based on the most recent Mortgage that was taken out on this home.
Original Mortgage
$320,000
Interest Rate
6.27%
Mortgage Type
New Conventional
Create a Home Valuation Report for This Property
The Home Valuation Report is an in-depth analysis detailing your home's value as well as a comparison with similar homes in the area
Home Values in the Area
Average Home Value in this Area
Purchase History
| Date | Buyer | Sale Price | Title Company |
|---|---|---|---|
| Wu Bingwen | $158,000 | -- | |
| Indymac Bank F S B | $170,100 | -- | |
| Nkeutchatang Jossette | $400,000 | -- |
Source: Public Records
Mortgage History
| Date | Status | Borrower | Loan Amount |
|---|---|---|---|
| Open | Wu Bingwen | $118,500 | |
| Previous Owner | Nkeutchatang Jossette | $320,000 |
Source: Public Records
Tax History Compared to Growth
Tax History
| Year | Tax Paid | Tax Assessment Tax Assessment Total Assessment is a certain percentage of the fair market value that is determined by local assessors to be the total taxable value of land and additions on the property. | Land | Improvement |
|---|---|---|---|---|
| 2025 | $5,458 | $434,350 | $190,000 | $244,350 |
| 2024 | $5,458 | $384,770 | $170,000 | $214,770 |
| 2023 | $5,343 | $384,770 | $170,000 | $214,770 |
| 2022 | $5,061 | $359,290 | $150,000 | $209,290 |
| 2021 | $3,959 | $337,340 | $135,000 | $202,340 |
| 2020 | $3,880 | $327,830 | $135,000 | $192,830 |
| 2019 | $3,880 | $327,830 | $135,000 | $192,830 |
| 2018 | $3,526 | $306,580 | $115,000 | $191,580 |
| 2017 | $3,334 | $287,160 | $115,000 | $172,160 |
| 2016 | $3,361 | $290,100 | $114,000 | $176,100 |
| 2015 | $3,238 | $290,100 | $114,000 | $176,100 |
| 2014 | $2,915 | $261,820 | $102,000 | $159,820 |
Source: Public Records
Map
Nearby Homes
- 978 Branch Dr
- 1018 Knight Ln
- 1089 Knight Ln
- 879 Station St
- 1029 Kings Ct
- 802 Vine St
- 1020 Queens Ct
- 1074 Trevino Ln
- 702 Elden St Unit B
- 1120 Stevenson Ct
- 1012 Grant St
- 1117 Player Way
- 1129 Player Way
- 904 Locust St
- 409 Madison Manor Ct
- 1191 Monroe St
- 903 Young Dairy Ct
- 615 Center St Unit T4
- 838 Colvin Ct
- 1233 Cooper Station Rd