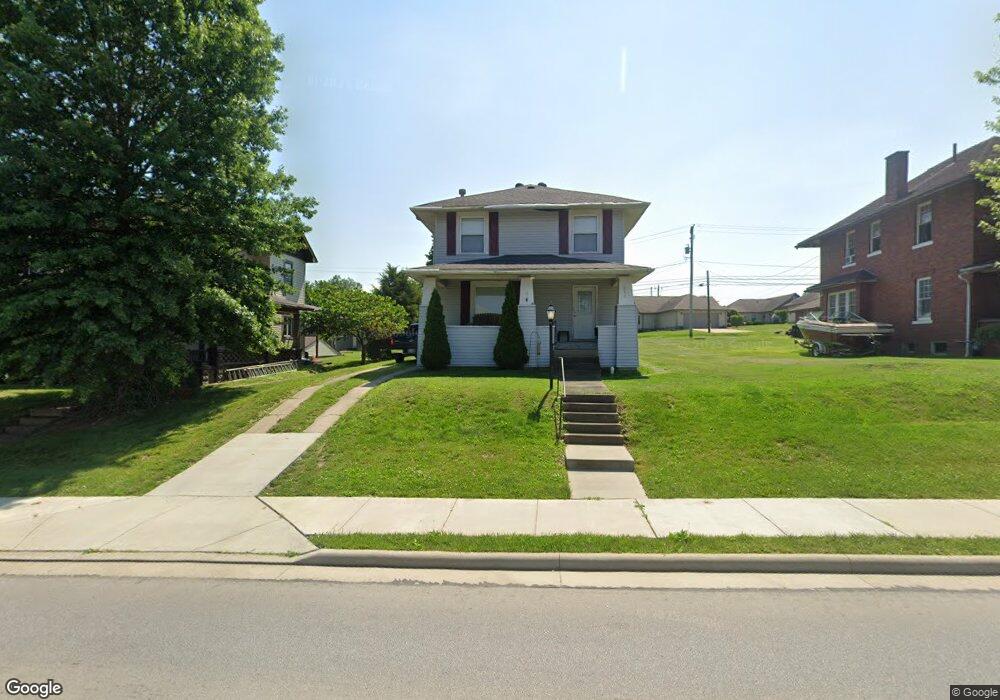
926 Clark St Cambridge, OH 43725
Estimated Value: $159,884 - $208,000
3
Beds
2
Baths
1,524
Sq Ft
$120/Sq Ft
Est. Value
About This Home
This home is located at 926 Clark St, Cambridge, OH 43725 and is currently estimated at $182,721, approximately $119 per square foot. 926 Clark St is a home located in Guernsey County with nearby schools including Cambridge High School, Foxfire East Academy, and St. Benedict Elementary School.
Ownership History
Date
Name
Owned For
Owner Type
Purchase Details
Closed on
Mar 3, 2014
Sold by
Billos Missy J
Bought by
Gotschall Douglas U
Current Estimated Value
Purchase Details
Closed on
Jun 30, 2008
Sold by
Wiley Kenneth R and Wiley Shelia
Bought by
Billos Missy J
Home Financials for this Owner
Home Financials are based on the most recent Mortgage that was taken out on this home.
Original Mortgage
$88,511
Interest Rate
6.05%
Mortgage Type
Adjustable Rate Mortgage/ARM
Purchase Details
Closed on
Feb 15, 2008
Sold by
Deutsche Bank National Trust Company
Bought by
Wiley Kenneth R
Home Financials for this Owner
Home Financials are based on the most recent Mortgage that was taken out on this home.
Original Mortgage
$48,800
Interest Rate
5.74%
Mortgage Type
Future Advance Clause Open End Mortgage
Purchase Details
Closed on
Jul 27, 2005
Sold by
Combs Ronald D and Combs Rebecca A
Bought by
Baldwin Patricia A
Home Financials for this Owner
Home Financials are based on the most recent Mortgage that was taken out on this home.
Original Mortgage
$93,484
Interest Rate
10.34%
Mortgage Type
Adjustable Rate Mortgage/ARM
Create a Home Valuation Report for This Property
The Home Valuation Report is an in-depth analysis detailing your home's value as well as a comparison with similar homes in the area
Home Values in the Area
Average Home Value in this Area
Purchase History
| Date | Buyer | Sale Price | Title Company |
|---|---|---|---|
| Gotschall Douglas U | $62,000 | None Available | |
| Billos Missy J | $89,900 | -- | |
| Wiley Kenneth R | $61,000 | -- | |
| Baldwin Patricia A | $98,500 | -- |
Source: Public Records
Mortgage History
| Date | Status | Borrower | Loan Amount |
|---|---|---|---|
| Previous Owner | Billos Missy J | $88,511 | |
| Previous Owner | Wiley Kenneth R | $48,800 | |
| Previous Owner | Baldwin Patricia A | $93,484 |
Source: Public Records
Tax History
| Year | Tax Paid | Tax Assessment Tax Assessment Total Assessment is a certain percentage of the fair market value that is determined by local assessors to be the total taxable value of land and additions on the property. | Land | Improvement |
|---|---|---|---|---|
| 2024 | $1,874 | $36,746 | $8,396 | $28,350 |
| 2023 | $1,826 | $31,370 | $7,168 | $24,202 |
| 2022 | $1,590 | $31,380 | $7,170 | $24,210 |
| 2021 | $1,574 | $31,380 | $7,170 | $24,210 |
| 2020 | $1,485 | $29,280 | $6,360 | $22,920 |
| 2019 | $1,469 | $29,280 | $6,360 | $22,920 |
| 2018 | $1,330 | $29,280 | $6,360 | $22,920 |
| 2017 | $1,274 | $25,390 | $5,530 | $19,860 |
| 2016 | $1,274 | $25,390 | $5,530 | $19,860 |
| 2015 | $1,274 | $25,390 | $5,530 | $19,860 |
| 2014 | -- | $22,670 | $4,810 | $17,860 |
| 2013 | $576 | $22,670 | $4,810 | $17,860 |
Source: Public Records
Map
Nearby Homes
- 1307 Cobo Ln
- 1121 Clark St
- 723 N 16th St
- 808 N 12th St
- 615 Clark St
- 1515 Stewart Ave
- 441 Oakland Blvd
- 614 N 11th St
- 614 N North 11th St
- 516 N 11th St
- 410 N 15th St
- 914 Taylor Ave
- 548 Highland Ave
- 913 Foster Ave
- 503 N 10th St
- 1102 Beatty Ave
- 914 Stewart Ave
- 515 N 9th St
- 1236 Gomber Ave
- 1355 Highland Ave
- 1504 Brenton Rd
- 1506 Brenton Rd
- 922 Clark St
- 930 Clark St
- 1508 Brenton Rd
- 1521 Clairmont Ave
- 1510 Brenton Rd
- 1010 Clark St
- 1012 Clark St
- 914 Clark St
- 1519 Clairmont Ave
- 1602 Brenton Rd
- 1014 Clark St
- 906 Clark St
- 1517 Clairmont Ave
- 931 Clark St
- 1527 Clairmont Ave
- 915 Clark St
- 1013 Clark St
- 927 Clark St