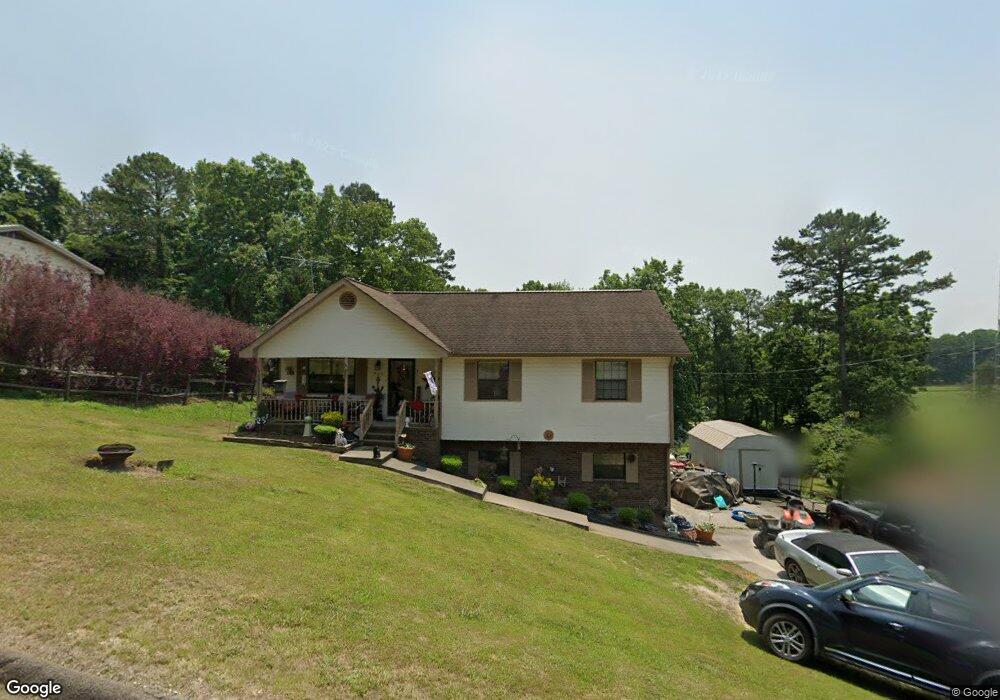
926 Crest Dr Chickamauga, GA 30707
Estimated Value: $221,617 - $294,000
3
Beds
2
Baths
1,340
Sq Ft
$187/Sq Ft
Est. Value
About This Home
This home is located at 926 Crest Dr, Chickamauga, GA 30707 and is currently estimated at $250,904, approximately $187 per square foot. 926 Crest Dr is a home located in Walker County with nearby schools including Cherokee Ridge Elementary School, Chattanooga Valley Middle School, and Ridgeland High School.
Ownership History
Date
Name
Owned For
Owner Type
Purchase Details
Closed on
Nov 21, 2008
Sold by
Not Provided
Bought by
Barrett Linda and Barrett Earl M
Current Estimated Value
Home Financials for this Owner
Home Financials are based on the most recent Mortgage that was taken out on this home.
Original Mortgage
$47,000
Outstanding Balance
$30,098
Interest Rate
6.01%
Mortgage Type
New Conventional
Estimated Equity
$220,806
Purchase Details
Closed on
Sep 16, 2003
Sold by
Fairbanks Capital Corp
Bought by
Wash Jonathon E
Purchase Details
Closed on
Jul 1, 2003
Sold by
Mcmahan James R and Mcmahan Jessica D
Bought by
Fairbanks Capital Corp
Purchase Details
Closed on
May 6, 1999
Sold by
Kight Ronnie D and Kight Andrea
Bought by
Mcmahan James R and Mcmahan Jessica D
Purchase Details
Closed on
Jul 28, 1989
Sold by
James E Leeth
Bought by
Kight Ronnie D and Kight Andrea
Purchase Details
Closed on
Jan 1, 1972
Bought by
James E Leeth
Create a Home Valuation Report for This Property
The Home Valuation Report is an in-depth analysis detailing your home's value as well as a comparison with similar homes in the area
Purchase History
| Date | Buyer | Sale Price | Title Company |
|---|---|---|---|
| Barrett Linda | $103,000 | -- | |
| Wash Jonathon E | $79,000 | -- | |
| Fairbanks Capital Corp | -- | -- | |
| Mcmahan James R | $79,000 | -- | |
| Kight Ronnie D | $4,000 | -- | |
| James E Leeth | -- | -- |
Source: Public Records
Mortgage History
| Date | Status | Borrower | Loan Amount |
|---|---|---|---|
| Open | Barrett Linda | $47,000 |
Source: Public Records
Tax History
| Year | Tax Paid | Tax Assessment Tax Assessment Total Assessment is a certain percentage of the fair market value that is determined by local assessors to be the total taxable value of land and additions on the property. | Land | Improvement |
|---|---|---|---|---|
| 2025 | $1,632 | $77,274 | $4,140 | $73,134 |
| 2024 | $1,686 | $76,054 | $3,600 | $72,454 |
| 2023 | $1,635 | $72,122 | $3,600 | $68,522 |
| 2022 | $1,531 | $62,294 | $3,600 | $58,694 |
| 2021 | $1,208 | $43,911 | $3,600 | $40,311 |
| 2020 | $1,038 | $36,010 | $3,600 | $32,410 |
| 2019 | $1,056 | $36,010 | $3,600 | $32,410 |
| 2018 | $953 | $36,010 | $3,600 | $32,410 |
| 2017 | $1,392 | $43,858 | $11,448 | $32,410 |
| 2016 | $1,154 | $43,858 | $11,448 | $32,410 |
| 2015 | $982 | $34,705 | $4,464 | $30,241 |
| 2014 | $890 | $34,705 | $4,464 | $30,241 |
| 2013 | -- | $34,705 | $4,464 | $30,241 |
Source: Public Records
Map
Nearby Homes
- 923 Crest Dr
- 944 Hurtt Rd
- 932 Johnson Rd
- 30 Boseman Ln
- 191 Haleys Cove Dr
- 1208 Johnson Rd
- 117 S Forest Rd
- 112 Raymond Ln
- 61 Vista Dr
- 633 E Garden Farm Rd
- 1068 Rogers Rd
- 614 W Garden Farm Rd
- 733 Crestridge Dr
- 705 Scenic Dr
- 710 Mission Ridge Rd
- 2548 N Highway 341
- 72 Rohan Ln
- 201 Laurelwood Cir
- 00 N Highway 341
- 1343 N Highway 341
Your Personal Tour Guide
Ask me questions while you tour the home.