926 E Sanderling St Ontario, CA 91761
Downtown Ontario NeighborhoodEstimated Value: $710,000 - $788,000
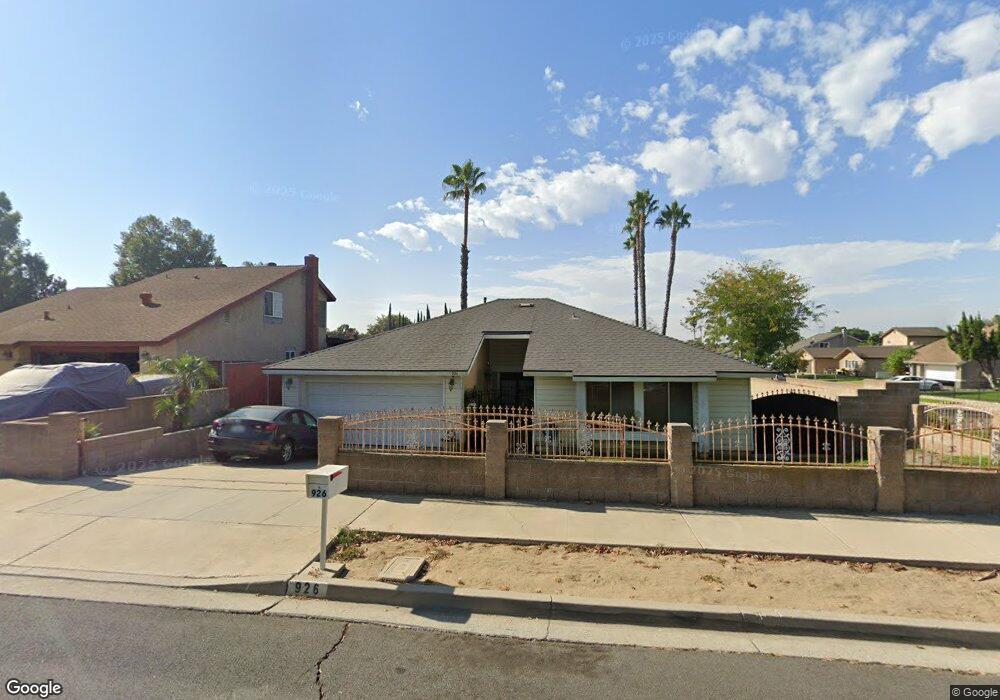
About This Home
This home is located at 926 E Sanderling St, Ontario, CA 91761 and is currently estimated at $736,040, approximately $454 per square foot. 926 E Sanderling St is a home located in San Bernardino County with nearby schools including Bon View Elementary, De Anza Middle, and Ontario High School.
Ownership History
We collect this data history from publicly available records. To have your information removed, we recommend requesting removal directly through your county’s website.
Purchase Details
Home Financials for this Owner
Home Financials are based on the most recent Mortgage that was taken out on this home.Home Values in the Area
Average Home Value in this Area
Purchase History
We collect this data history from publicly available records. To have your information removed, we recommend requesting removal directly through your county’s website.
| Date | Buyer | Sale Price | Title Company |
|---|---|---|---|
| $172,000 | Chicago Title Co |
Mortgage History
We collect this data history from publicly available records. To have your information removed, we recommend requesting removal directly through your county’s website.
| Date | Status | Borrower | Loan Amount |
|---|---|---|---|
| Open | $137,600 |
Tax History
We collect this data history from publicly available records. To have your information removed, we recommend requesting removal directly through your county’s website.
| Year | Tax Paid | Tax Assessment Tax Assessment Total Assessment is a certain percentage of the fair market value that is determined by local assessors to be the total taxable value of land and additions on the property. | Land | Improvement |
|---|---|---|---|---|
| 2025 | $2,908 | $259,180 | $90,711 | $168,469 |
| 2024 | $2,844 | $254,098 | $88,932 | $165,166 |
| 2023 | $2,766 | $249,115 | $87,188 | $161,927 |
| 2022 | $2,730 | $244,230 | $85,478 | $158,752 |
| 2021 | $2,713 | $239,441 | $83,802 | $155,639 |
| 2020 | $2,667 | $236,986 | $82,943 | $154,043 |
| 2019 | $2,644 | $232,340 | $81,317 | $151,023 |
| 2018 | $2,609 | $227,785 | $79,723 | $148,062 |
| 2017 | $2,517 | $223,319 | $78,160 | $145,159 |
| 2016 | $2,420 | $218,940 | $76,627 | $142,313 |
| 2015 | $2,404 | $215,651 | $75,476 | $140,175 |
| 2014 | $2,332 | $211,427 | $73,998 | $137,429 |
Map
- 3142 E Mt Rainier
- 4711 S Solstice Ave
- 1528 1538 W Holt
- 1305 W North Pinecrest
- 4333 S Grasly Paseo
- 840 E Cedar St
- 2420 Caldwell Place
- 2310 S Cucamonga Ave
- 2017 S Campus Ave Unit F
- 2544 S Garfield Place
- 649 E Fairfield Ct
- 1132 E Cherry Hill St
- 514 E Skylark Dr
- 2300 S Sultana Ave Unit 286
- 2300 S Sultana Ave Unit 256
- 2300 S Sultana Ave Unit 206
- 310 E Philadelphia St
- 310 E Philadelphia St Unit Sp 25
- 576 E Tam o Shanter St
- 1456 E Philadelphia St Unit 134
- 930 E Sanderling St
- 936 E Sanderling St
- 942 E Sanderling St
- 931 E Monticello Ct
- 925 E Monticello Ct
- 937 E Monticello Ct Unit 18
- 943 E Monticello Ct Unit 19
- 931 E Sanderling St
- 925 E Sanderling St
- 937 E Sanderling St
- 2242 S Greenwood Place
- 2242 S Greenwood Place Unit A
- 2242 S Greenwood Place Unit B
- 2220 S Greenwood Place Unit D
- 2220 S Greenwood Place Unit C
- 2220 S Greenwood Place Unit B
- 2220 S Greenwood Place Unit A
- 919 E Sanderling St
- 2220 S Goldcrest Ave
- 2228 S Goldcrest Ave
Ask me questions while you tour the home.