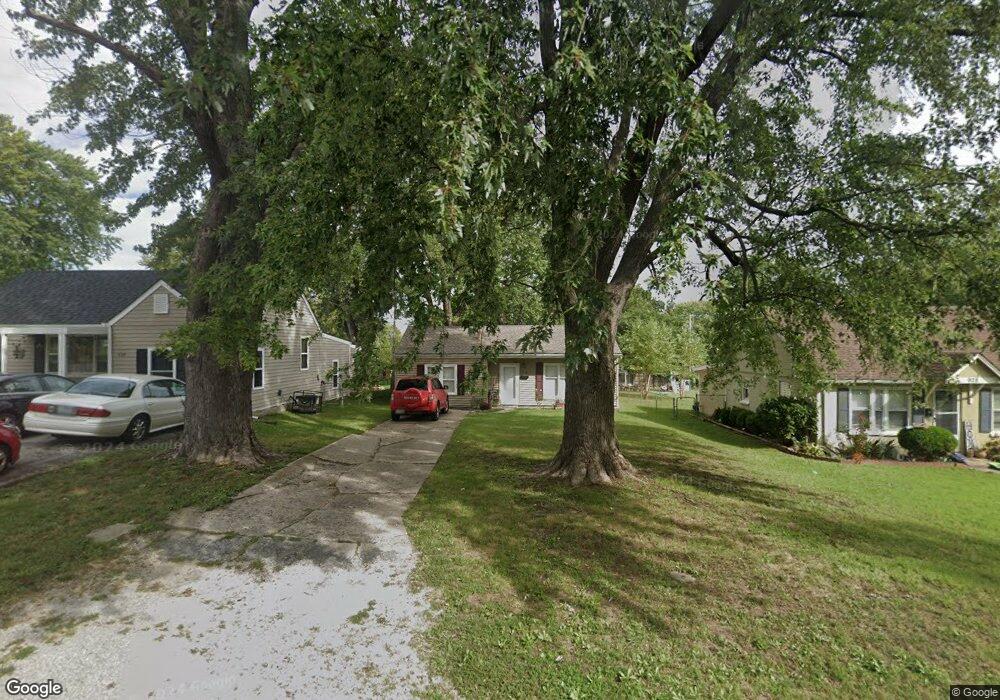
926 E South Ave Independence, MO 64050
Benton NeighborhoodEstimated Value: $141,000 - $178,000
2
Beds
1
Bath
1,399
Sq Ft
$120/Sq Ft
Est. Value
About This Home
This home is located at 926 E South Ave, Independence, MO 64050 and is currently estimated at $168,466, approximately $120 per square foot. 926 E South Ave is a home located in Jackson County with nearby schools including Thomas Hart Benton Elementary School, Bridger Middle School, and Bingham Middle School.
Ownership History
Date
Name
Owned For
Owner Type
Purchase Details
Closed on
Jun 12, 2019
Sold by
Elsey Donna L and Elsey Michael J
Bought by
Rice Laura E
Current Estimated Value
Home Financials for this Owner
Home Financials are based on the most recent Mortgage that was taken out on this home.
Original Mortgage
$64,000
Outstanding Balance
$56,272
Interest Rate
4.1%
Mortgage Type
New Conventional
Estimated Equity
$112,194
Purchase Details
Closed on
Nov 22, 2004
Sold by
Elsey Donna L and Elsey Michael J
Bought by
Elsey Michael J and Elsey Donna L
Create a Home Valuation Report for This Property
The Home Valuation Report is an in-depth analysis detailing your home's value as well as a comparison with similar homes in the area
Home Values in the Area
Average Home Value in this Area
Purchase History
| Date | Buyer | Sale Price | Title Company |
|---|---|---|---|
| Rice Laura E | -- | First American Title | |
| Elsey Michael J | -- | -- |
Source: Public Records
Mortgage History
| Date | Status | Borrower | Loan Amount |
|---|---|---|---|
| Open | Rice Laura E | $64,000 |
Source: Public Records
Tax History
| Year | Tax Paid | Tax Assessment Tax Assessment Total Assessment is a certain percentage of the fair market value that is determined by local assessors to be the total taxable value of land and additions on the property. | Land | Improvement |
|---|---|---|---|---|
| 2025 | $1,714 | $20,604 | $3,570 | $17,034 |
| 2024 | $1,675 | $24,740 | $3,276 | $21,464 |
| 2023 | $1,675 | $24,740 | $3,196 | $21,544 |
| 2022 | $1,151 | $15,580 | $1,732 | $13,848 |
| 2021 | $1,150 | $15,580 | $1,732 | $13,848 |
| 2020 | $1,039 | $13,669 | $1,732 | $11,937 |
| 2019 | $1,022 | $13,669 | $1,732 | $11,937 |
| 2018 | $932 | $11,897 | $1,508 | $10,389 |
| 2017 | $932 | $11,897 | $1,508 | $10,389 |
| 2016 | $917 | $11,598 | $1,761 | $9,837 |
Source: Public Records
Map
Nearby Homes
- 914 E South Ave
- 903 S Pope Ave
- 1040 E Stone St
- 930 S Leslie St
- 913 S Hocker Ave
- 801 S Crane St
- 715 S Savage St
- 1124 S Haden St
- 528 S Crane St
- 1319 S Crane St
- 504 S Hunter St
- 904 S Pearl St
- 1109 S Woodbury St
- 325 S Crane St
- 1340 S Emery Ave
- 1339 S Hocker Ave
- 921 S Noland Rd
- 1100 S Noland Rd
- 421 E Angus St
- 426 E Short Ave
- 924 E South Ave
- 928 E South Ave
- 920 E South Ave
- 1000 E South Ave
- 935 E South Ave
- 916 E South Ave
- 921 E South Ave
- 1001 E South Ave
- 1004 E South Ave
- 1003 E South Ave
- 929 E Sea Ave
- 933 E Sea Ave
- 915 E South Ave
- 931 E Sea Ave
- 1005 E South Ave
- 1006 E South Ave
- 913 E South Ave
- 912 E South Ave
- 935 E Sea Ave
- 927 E Sea Ave
Your Personal Tour Guide
Ask me questions while you tour the home.