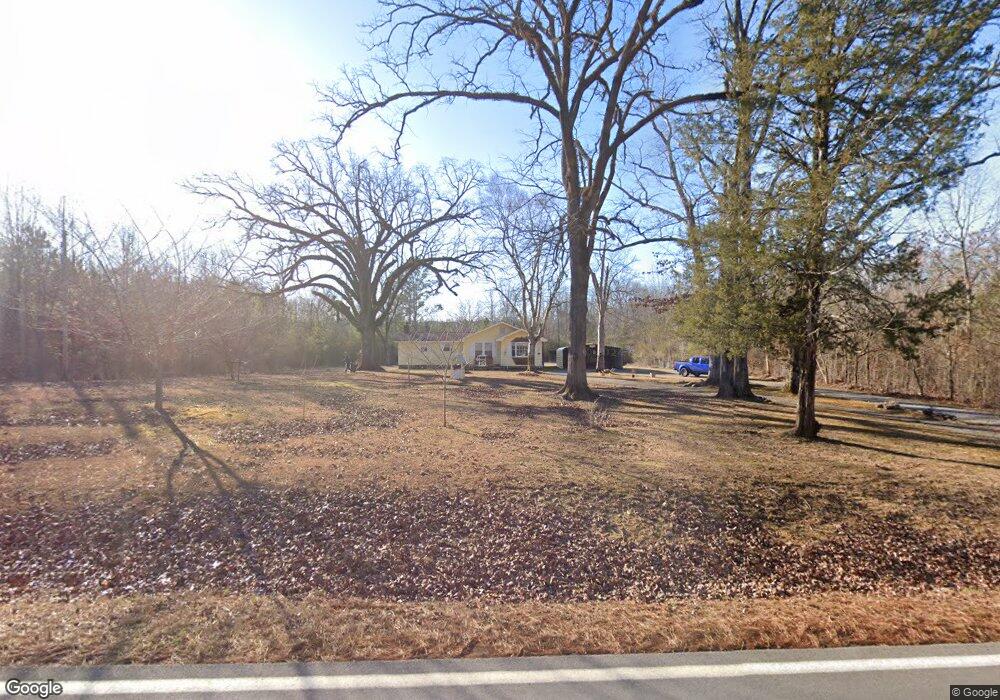
926 Everett Springs Rd NE Calhoun, GA 30701
Estimated Value: $282,316 - $444,000
--
Bed
2
Baths
1,696
Sq Ft
$205/Sq Ft
Est. Value
About This Home
This home is located at 926 Everett Springs Rd NE, Calhoun, GA 30701 and is currently estimated at $348,439, approximately $205 per square foot. 926 Everett Springs Rd NE is a home with nearby schools including Armuchee Middle School and Armuchee High School.
Ownership History
Date
Name
Owned For
Owner Type
Purchase Details
Closed on
Dec 23, 2009
Sold by
Atkins Howard Logan and Atkins Linda Kim
Bought by
Atkins Howard L and Atkins Linda K
Current Estimated Value
Home Financials for this Owner
Home Financials are based on the most recent Mortgage that was taken out on this home.
Original Mortgage
$69,000
Interest Rate
4.29%
Mortgage Type
New Conventional
Purchase Details
Closed on
Dec 15, 1998
Sold by
Green Martha R and Thacker Lisa R
Bought by
Atkins Howard Logan and Linda Kim Atk
Purchase Details
Closed on
May 11, 1994
Sold by
Evans Gary G
Bought by
Green Martha R and Thacker Lisa R
Purchase Details
Closed on
Sep 5, 1989
Sold by
Evans Gary G and Evans Loretta J
Bought by
Evans Gary G
Purchase Details
Closed on
Sep 30, 1987
Bought by
P and R
Purchase Details
Closed on
Feb 17, 1977
Bought by
P and R
Purchase Details
Closed on
Sep 30, 1975
Bought by
Evans Gary G and Evans Loretta J
Create a Home Valuation Report for This Property
The Home Valuation Report is an in-depth analysis detailing your home's value as well as a comparison with similar homes in the area
Home Values in the Area
Average Home Value in this Area
Purchase History
| Date | Buyer | Sale Price | Title Company |
|---|---|---|---|
| Atkins Howard L | -- | -- | |
| Atkins Howard Logan | $110,000 | -- | |
| Green Martha R | $79,000 | -- | |
| Evans Gary G | -- | -- | |
| P | -- | -- | |
| P | -- | -- | |
| Evans Gary G | $20,000 | -- |
Source: Public Records
Mortgage History
| Date | Status | Borrower | Loan Amount |
|---|---|---|---|
| Closed | Atkins Howard L | $69,000 |
Source: Public Records
Tax History Compared to Growth
Tax History
| Year | Tax Paid | Tax Assessment Tax Assessment Total Assessment is a certain percentage of the fair market value that is determined by local assessors to be the total taxable value of land and additions on the property. | Land | Improvement |
|---|---|---|---|---|
| 2024 | $522 | $91,230 | $34,822 | $56,408 |
| 2023 | $554 | $80,688 | $31,656 | $49,032 |
| 2022 | $916 | $63,057 | $26,380 | $36,677 |
| 2021 | $791 | $53,009 | $23,800 | $29,209 |
| 2020 | $774 | $48,438 | $20,698 | $27,740 |
| 2019 | $727 | $46,623 | $20,698 | $25,925 |
| 2018 | $701 | $44,168 | $19,716 | $24,452 |
| 2017 | $688 | $41,817 | $18,255 | $23,562 |
| 2016 | $684 | $41,269 | $18,200 | $23,069 |
| 2015 | $666 | $41,309 | $18,240 | $23,069 |
| 2014 | $666 | $41,309 | $18,240 | $23,069 |
Source: Public Records
Map
Nearby Homes
- 1216 Everett Springs Rd NE
- 0 Culpepper Rd NE Unit 7592082
- 0 Culpepper Rd NE Unit 7651484
- 0 Culpepper Rd NE Unit TRACT 1 & 2 10607389
- 0 Culpepper Rd NE Unit 10536672
- 0 Culpepper Rd NE Unit TRACT 1 10540091
- 0 Culpepper Rd NE Unit TRACT 2 10540088
- 1434 Culpepper Rd NE
- 5452 Old Dalton Rd NE
- 418 Dunaway Gap Rd
- 821 Everett Springs Rd NE
- 260 Lovers Ln NE
- 2324 Floyd Springs Rd NE
- 496 Flat Woods Rd
- 325 Everett Springs Rd
- 4569 Old Dalton Rd NE
- 334 Armuchee Trail NE
- 1465 Turner Rd NE
- 1603 Floyd Springs Rd NE
- 311 Herring Rd NE
- 875 Everett Springs Rd SW
- 845 Everett Springs Rd SW
- 941 Everett Springs Rd NE
- 844 Everett Springs Rd NE
- 928 Everett Springs Rd NE
- 963 Everett Springs Rd NE
- 963 Everett Springs Rd NE
- 814 Everett Springs Rd NE
- 896 Everett Springs Rd NE
- 750 Everett Springs Rd NE
- 732 Everett Springs Rd NE
- 720 Everett Springs Rd NE
- 720 Everett Springs Rd NE
- 1035 Everett Springs Rd SW
- 1782 Everett Springs Rd NE
- 1045 Everett Springs Rd SW
- 686 Everett Springs Rd NE
- 782 Everett Springs Rd NE
- 703 Everett Springs Rd NE
- 1132 Everett Springs Rd NE