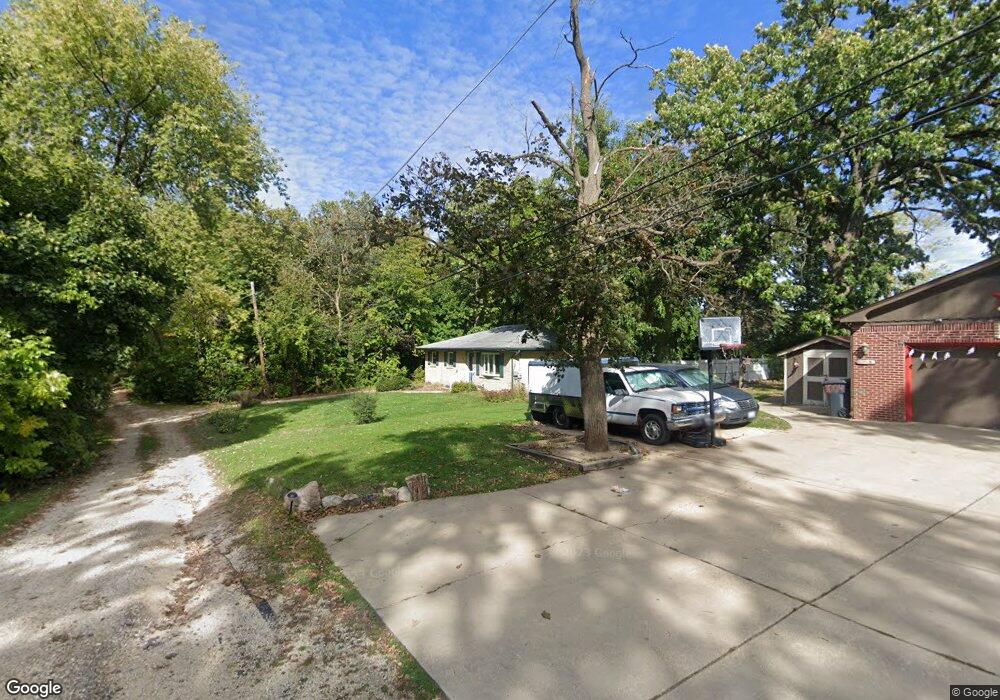
926 Julien St Belvidere, IL 61008
Estimated Value: $142,000 - $180,315
3
Beds
2
Baths
1,218
Sq Ft
$138/Sq Ft
Est. Value
About This Home
This home is located at 926 Julien St, Belvidere, IL 61008 and is currently estimated at $167,829, approximately $137 per square foot. 926 Julien St is a home located in Boone County with nearby schools including Lincoln Elementary School, Belvidere South Middle School, and Belvidere High School.
Ownership History
Date
Name
Owned For
Owner Type
Purchase Details
Closed on
Nov 16, 2023
Sold by
Ccsip Properties Inc
Bought by
Miner Tyler J
Current Estimated Value
Home Financials for this Owner
Home Financials are based on the most recent Mortgage that was taken out on this home.
Original Mortgage
$111,935
Outstanding Balance
$110,027
Interest Rate
7.62%
Mortgage Type
Construction
Estimated Equity
$57,802
Purchase Details
Closed on
Jan 6, 2010
Bought by
Hardy Travis B
Create a Home Valuation Report for This Property
The Home Valuation Report is an in-depth analysis detailing your home's value as well as a comparison with similar homes in the area
Home Values in the Area
Average Home Value in this Area
Purchase History
| Date | Buyer | Sale Price | Title Company |
|---|---|---|---|
| Miner Tyler J | $114,000 | Attorneys Title Guaranty Fund | |
| Hardy Travis B | $59,000 | -- |
Source: Public Records
Mortgage History
| Date | Status | Borrower | Loan Amount |
|---|---|---|---|
| Open | Miner Tyler J | $111,935 | |
| Closed | Miner Tyler J | $6,000 |
Source: Public Records
Tax History Compared to Growth
Tax History
| Year | Tax Paid | Tax Assessment Tax Assessment Total Assessment is a certain percentage of the fair market value that is determined by local assessors to be the total taxable value of land and additions on the property. | Land | Improvement |
|---|---|---|---|---|
| 2024 | $3,663 | $48,380 | $3,882 | $44,498 |
| 2023 | $3,663 | $43,631 | $5,953 | $37,678 |
| 2022 | $3,322 | $40,303 | $5,953 | $34,350 |
| 2021 | $3,137 | $38,317 | $5,953 | $32,364 |
| 2020 | $2,961 | $34,713 | $6,276 | $28,437 |
| 2019 | $2,809 | $51,442 | $25,105 | $26,337 |
| 2018 | $2,618 | $112,205 | $88,765 | $23,440 |
| 2017 | $2,536 | $29,936 | $6,577 | $23,359 |
| 2016 | $2,547 | $28,960 | $6,470 | $22,490 |
| 2015 | $2,443 | $27,409 | $8,088 | $19,321 |
| 2014 | $1,852 | $27,432 | $8,088 | $19,344 |
Source: Public Records
Map
Nearby Homes