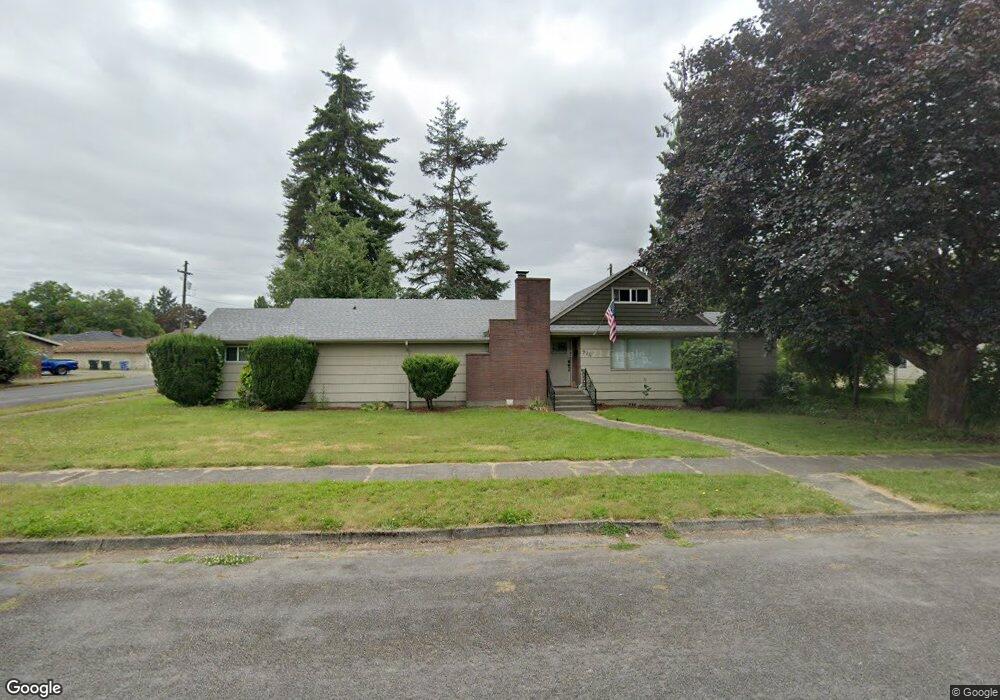
926 L St Centralia, WA 98531
Estimated Value: $398,000 - $440,000
4
Beds
2
Baths
1,965
Sq Ft
$213/Sq Ft
Est. Value
About This Home
This home is located at 926 L St, Centralia, WA 98531 and is currently estimated at $418,728, approximately $213 per square foot. 926 L St is a home located in Lewis County with nearby schools including Centralia Middle School, Centralia High School, and Evergreen Academy of Arts & Sciences.
Ownership History
Date
Name
Owned For
Owner Type
Purchase Details
Closed on
Jul 11, 2018
Sold by
Biggers Jonathan C and Biggers Kristi D
Bought by
Garcia Thomas J and Garcia Erin E
Current Estimated Value
Home Financials for this Owner
Home Financials are based on the most recent Mortgage that was taken out on this home.
Original Mortgage
$241,414
Outstanding Balance
$209,221
Interest Rate
4.5%
Mortgage Type
New Conventional
Estimated Equity
$209,507
Create a Home Valuation Report for This Property
The Home Valuation Report is an in-depth analysis detailing your home's value as well as a comparison with similar homes in the area
Home Values in the Area
Average Home Value in this Area
Purchase History
| Date | Buyer | Sale Price | Title Company |
|---|---|---|---|
| Garcia Thomas J | $239,000 | Title Guaranty |
Source: Public Records
Mortgage History
| Date | Status | Borrower | Loan Amount |
|---|---|---|---|
| Open | Garcia Thomas J | $241,414 |
Source: Public Records
Tax History Compared to Growth
Tax History
| Year | Tax Paid | Tax Assessment Tax Assessment Total Assessment is a certain percentage of the fair market value that is determined by local assessors to be the total taxable value of land and additions on the property. | Land | Improvement |
|---|---|---|---|---|
| 2024 | $2,641 | $402,600 | $85,000 | $317,600 |
| 2023 | $3,310 | $402,600 | $85,000 | $317,600 |
| 2022 | $2,966 | $299,600 | $48,700 | $250,900 |
| 2021 | $2,285 | $299,600 | $48,700 | $250,900 |
| 2020 | $2,675 | $257,200 | $46,900 | $210,300 |
| 2019 | $2,282 | $237,600 | $43,200 | $194,400 |
| 2018 | $2,187 | $194,600 | $35,200 | $159,400 |
| 2017 | $1,742 | $163,800 | $35,200 | $128,600 |
| 2016 | $1,621 | $172,400 | $37,000 | $135,400 |
| 2015 | $1,511 | $158,000 | $50,100 | $107,900 |
| 2013 | $1,511 | $157,900 | $50,100 | $107,800 |
Source: Public Records
Map
Nearby Homes