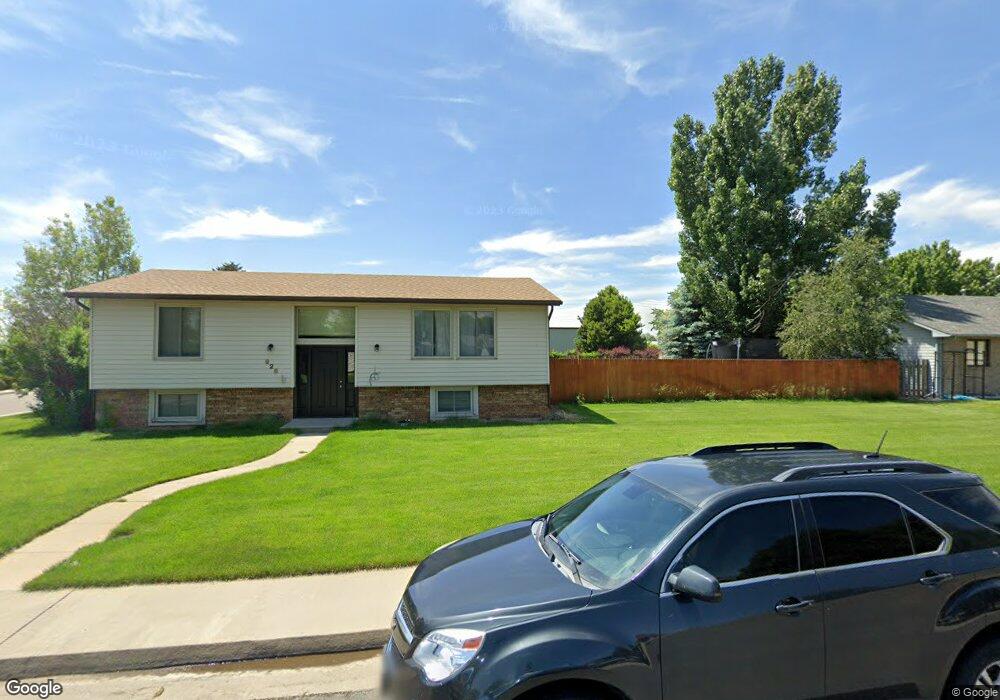
926 Meng Dr Fort Morgan, CO 80701
Estimated Value: $321,000 - $349,000
4
Beds
2
Baths
1,880
Sq Ft
$180/Sq Ft
Est. Value
About This Home
This home is located at 926 Meng Dr, Fort Morgan, CO 80701 and is currently estimated at $338,833, approximately $180 per square foot. 926 Meng Dr is a home located in Morgan County with nearby schools including Fort Morgan High School and Lighthouse Seventh-day Adventist Christian School.
Ownership History
Date
Name
Owned For
Owner Type
Purchase Details
Closed on
May 27, 2011
Sold by
Us Bank National Association
Bought by
Bills Tim
Current Estimated Value
Home Financials for this Owner
Home Financials are based on the most recent Mortgage that was taken out on this home.
Original Mortgage
$113,850
Outstanding Balance
$78,559
Interest Rate
4.65%
Mortgage Type
New Conventional
Estimated Equity
$260,274
Purchase Details
Closed on
Feb 18, 2011
Sold by
Mckenzie James D and Mckenzie Diana K
Bought by
Us Bank National Association
Purchase Details
Closed on
Dec 7, 2005
Sold by
Kuretich Sandra D
Bought by
Mckenzie James D and Mckenzie Diana K
Home Financials for this Owner
Home Financials are based on the most recent Mortgage that was taken out on this home.
Original Mortgage
$31,280
Interest Rate
6.3%
Mortgage Type
Stand Alone Second
Create a Home Valuation Report for This Property
The Home Valuation Report is an in-depth analysis detailing your home's value as well as a comparison with similar homes in the area
Home Values in the Area
Average Home Value in this Area
Purchase History
| Date | Buyer | Sale Price | Title Company |
|---|---|---|---|
| Bills Tim | $1,100 | None Available | |
| Us Bank National Association | -- | None Available | |
| Mckenzie James D | $156,400 | None Available |
Source: Public Records
Mortgage History
| Date | Status | Borrower | Loan Amount |
|---|---|---|---|
| Open | Bills Tim | $113,850 | |
| Previous Owner | Mckenzie James D | $31,280 | |
| Previous Owner | Mckenzie James D | $125,120 |
Source: Public Records
Tax History Compared to Growth
Tax History
| Year | Tax Paid | Tax Assessment Tax Assessment Total Assessment is a certain percentage of the fair market value that is determined by local assessors to be the total taxable value of land and additions on the property. | Land | Improvement |
|---|---|---|---|---|
| 2024 | $1,557 | $19,450 | $2,630 | $16,820 |
| 2023 | $1,557 | $23,140 | $3,130 | $20,010 |
| 2022 | $1,292 | $15,760 | $3,060 | $12,700 |
| 2021 | $1,330 | $16,210 | $3,150 | $13,060 |
| 2020 | $1,215 | $14,410 | $2,570 | $11,840 |
| 2019 | $1,217 | $14,410 | $2,570 | $11,840 |
| 2018 | $1,032 | $12,040 | $2,140 | $9,900 |
| 2017 | $1,033 | $12,040 | $2,140 | $9,900 |
| 2016 | $994 | $11,480 | $2,580 | $8,900 |
| 2015 | $980 | $11,480 | $2,580 | $8,900 |
| 2014 | $855 | $9,770 | $2,290 | $7,480 |
| 2013 | -- | $9,770 | $2,290 | $7,480 |
Source: Public Records
Map
Nearby Homes
- 620 Cherry St
- 435 Dahlia St
- 431 Dahlia St
- 423 Cherry St
- 417 Gayle St
- 402 Gayle St
- 335 Belmont Place
- 329 Ash St
- 303 Belmont Place
- 422 Elm St
- 520 Cove Ln
- 19411 County Road Q
- 16211 County Road 19
- 1072 E Burlington Ave
- 220 Spruce St
- 332 Circle Dr
- 300 Willow St
- 299 Willow St
- 298 Boxelder St
- 104 Gateway Ave