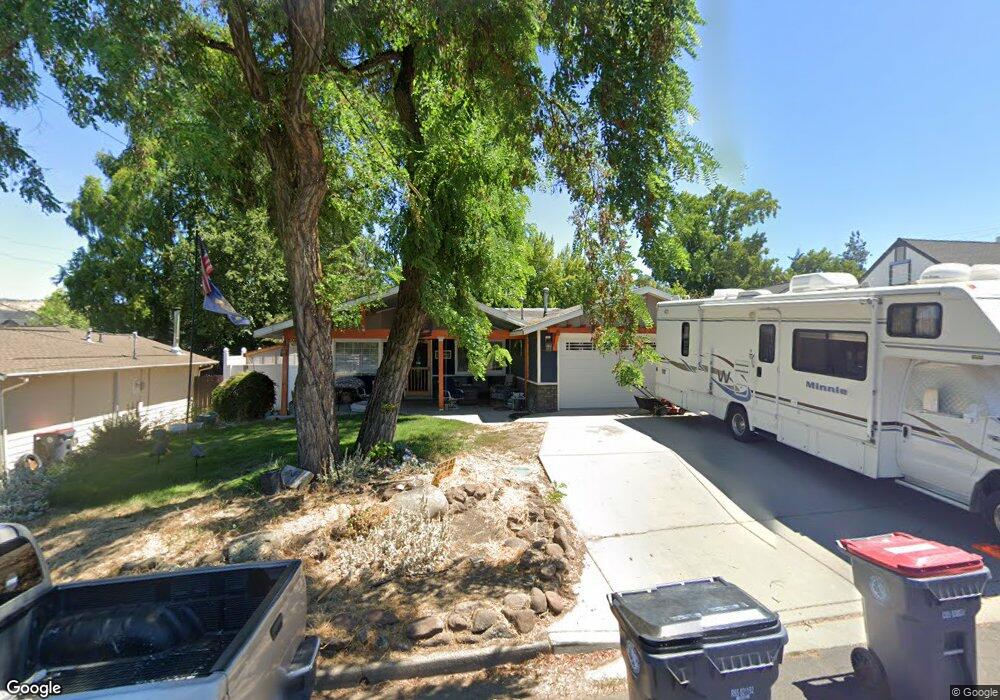
926 N Keeneway Dr Medford, OR 97504
College Hill NeighborhoodEstimated Value: $360,354 - $411,000
3
Beds
2
Baths
1,407
Sq Ft
$274/Sq Ft
Est. Value
About This Home
This home is located at 926 N Keeneway Dr, Medford, OR 97504 and is currently estimated at $384,839, approximately $273 per square foot. 926 N Keeneway Dr is a home located in Jackson County with nearby schools including Roosevelt Elementary School, Hedrick Middle School, and North Medford High School.
Ownership History
Date
Name
Owned For
Owner Type
Purchase Details
Closed on
Dec 17, 2018
Sold by
Watson Peggy Y
Bought by
Lansdown Jamie Lee and Lansdown Stephanie A
Current Estimated Value
Home Financials for this Owner
Home Financials are based on the most recent Mortgage that was taken out on this home.
Original Mortgage
$266,305
Outstanding Balance
$235,089
Interest Rate
4.9%
Mortgage Type
VA
Estimated Equity
$149,750
Purchase Details
Closed on
Jan 20, 2006
Sold by
Talbert Wanda D
Bought by
Watson Charles L and Watson Peggy Y
Home Financials for this Owner
Home Financials are based on the most recent Mortgage that was taken out on this home.
Original Mortgage
$200,000
Interest Rate
6.32%
Mortgage Type
Fannie Mae Freddie Mac
Purchase Details
Closed on
Oct 17, 2002
Sold by
Barnard Steven Curtis
Bought by
Talbert Wanda D
Home Financials for this Owner
Home Financials are based on the most recent Mortgage that was taken out on this home.
Original Mortgage
$113,300
Interest Rate
6.05%
Create a Home Valuation Report for This Property
The Home Valuation Report is an in-depth analysis detailing your home's value as well as a comparison with similar homes in the area
Home Values in the Area
Average Home Value in this Area
Purchase History
| Date | Buyer | Sale Price | Title Company |
|---|---|---|---|
| Lansdown Jamie Lee | $260,700 | Ticor Title Co | |
| Watson Charles L | $250,000 | First American | |
| Talbert Wanda D | $141,900 | First American Title Ins Co |
Source: Public Records
Mortgage History
| Date | Status | Borrower | Loan Amount |
|---|---|---|---|
| Open | Lansdown Jamie Lee | $266,305 | |
| Previous Owner | Watson Charles L | $200,000 | |
| Previous Owner | Talbert Wanda D | $113,300 |
Source: Public Records
Tax History Compared to Growth
Tax History
| Year | Tax Paid | Tax Assessment Tax Assessment Total Assessment is a certain percentage of the fair market value that is determined by local assessors to be the total taxable value of land and additions on the property. | Land | Improvement |
|---|---|---|---|---|
| 2025 | $2,685 | $185,110 | $74,520 | $110,590 |
| 2024 | $2,685 | $179,720 | $72,350 | $107,370 |
| 2023 | $2,602 | $174,490 | $70,250 | $104,240 |
| 2022 | $2,539 | $174,490 | $70,250 | $104,240 |
| 2021 | $2,473 | $169,410 | $68,200 | $101,210 |
| 2020 | $2,421 | $164,480 | $66,210 | $98,270 |
| 2019 | $2,364 | $155,040 | $62,400 | $92,640 |
| 2018 | $2,198 | $143,680 | $60,580 | $83,100 |
| 2017 | $2,159 | $143,680 | $60,580 | $83,100 |
| 2016 | $2,173 | $135,440 | $57,090 | $78,350 |
| 2015 | $2,089 | $135,440 | $57,090 | $78,350 |
| 2014 | $2,052 | $127,670 | $53,810 | $73,860 |
Source: Public Records
Map
Nearby Homes
- 1221 Skeeters Ln
- 1167 Skeeters Ln
- 1560 Cambridge Cir
- 1533 Lenora Dr
- 528 Pearl St
- 522 Pearl St
- 1917 Hybiscus St
- 1111 Stevens St Unit 1
- 1417 Larkspur Ave
- 1441 Larkspur Ave
- 1925 Stratford Ave
- 514 Marie St
- 1744 Carrera Cir
- 312 N Barneburg Rd
- 200 Oregon Terrace
- 889 Valley View Dr
- 313 Marie St
- 1215 Covina Ave
- 2030 Brookhurst St Unit 28
- 2020 Ridge Way
- 926 N Keene Way Dr
- 816 N Keene Way Dr
- 930 N Keene Way Dr
- 816 N Keeneway Dr
- 930 N Keeneway Dr
- 1425 Lawnridge St
- 1428 Spring St
- 934 N Keene Way Dr
- 901 N Keene Way Dr
- 1427 Lawnridge St
- 929 N Keene Way Dr
- 1454 Spring St
- 1443 Lawnridge St
- 1371 Lawnridge St
- 929 N Keeneway Dr
- 1366 Spring St
- 814 N Keene Way Dr
- 1460 Spring St
- 1367 Lawnridge St
- 1457 Lawnridge St