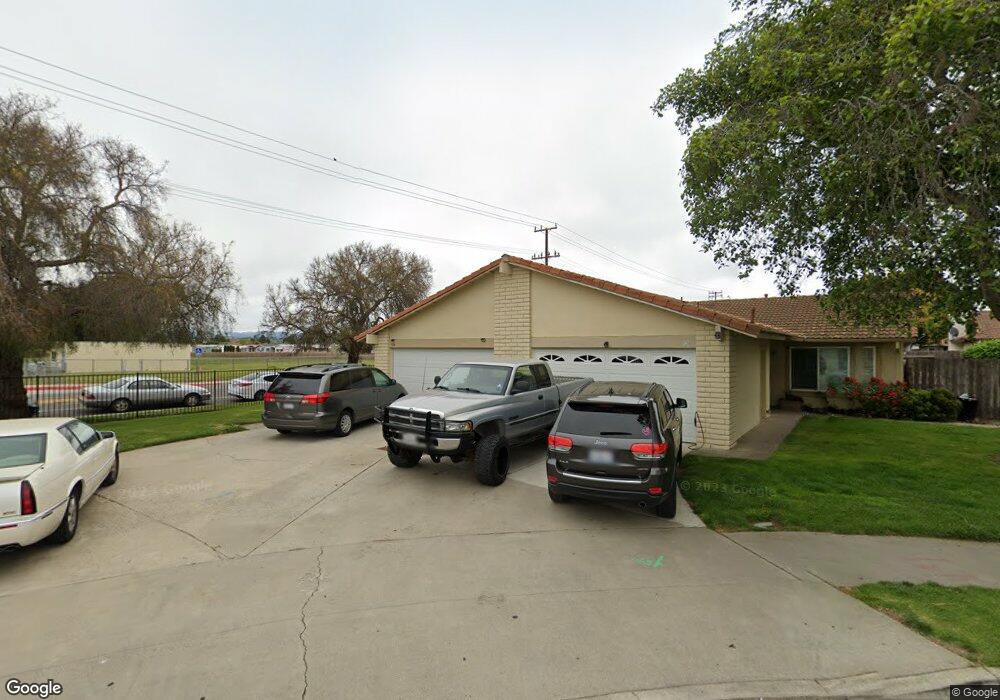
926 N M Place Lompoc, CA 93436
Estimated Value: $373,000 - $417,000
3
Beds
2
Baths
1,008
Sq Ft
$390/Sq Ft
Est. Value
About This Home
This home is located at 926 N M Place, Lompoc, CA 93436 and is currently estimated at $392,854, approximately $389 per square foot. 926 N M Place is a home located in Santa Barbara County with nearby schools including La Canada Elementary School, Lompoc Valley Middle School, and Lompoc High School.
Ownership History
Date
Name
Owned For
Owner Type
Purchase Details
Closed on
Feb 10, 2004
Sold by
Herrera Blanca
Bought by
Herrera Julio
Current Estimated Value
Home Financials for this Owner
Home Financials are based on the most recent Mortgage that was taken out on this home.
Original Mortgage
$172,500
Outstanding Balance
$69,045
Interest Rate
3.74%
Mortgage Type
Negative Amortization
Estimated Equity
$323,809
Purchase Details
Closed on
Jan 13, 1999
Sold by
Hunt James W and Hunt Melinda E
Bought by
Herrera Julio and Herrera Blanca
Home Financials for this Owner
Home Financials are based on the most recent Mortgage that was taken out on this home.
Original Mortgage
$85,276
Interest Rate
6.66%
Mortgage Type
FHA
Create a Home Valuation Report for This Property
The Home Valuation Report is an in-depth analysis detailing your home's value as well as a comparison with similar homes in the area
Home Values in the Area
Average Home Value in this Area
Purchase History
| Date | Buyer | Sale Price | Title Company |
|---|---|---|---|
| Herrera Julio | -- | Chicago Title Company | |
| Herrera Julio | $85,500 | First American Title Co |
Source: Public Records
Mortgage History
| Date | Status | Borrower | Loan Amount |
|---|---|---|---|
| Open | Herrera Julio | $172,500 | |
| Closed | Herrera Julio | $85,276 |
Source: Public Records
Tax History
| Year | Tax Paid | Tax Assessment Tax Assessment Total Assessment is a certain percentage of the fair market value that is determined by local assessors to be the total taxable value of land and additions on the property. | Land | Improvement |
|---|---|---|---|---|
| 2025 | $1,401 | $134,011 | $47,019 | $86,992 |
| 2023 | $1,401 | $128,810 | $45,195 | $83,615 |
| 2022 | $1,374 | $126,285 | $44,309 | $81,976 |
| 2021 | $1,386 | $123,810 | $43,441 | $80,369 |
| 2020 | $1,371 | $122,541 | $42,996 | $79,545 |
| 2019 | $1,346 | $120,139 | $42,153 | $77,986 |
| 2018 | $1,324 | $117,784 | $41,327 | $76,457 |
| 2017 | $1,298 | $115,475 | $40,517 | $74,958 |
| 2016 | $1,273 | $113,212 | $39,723 | $73,489 |
| 2014 | $1,243 | $109,330 | $38,361 | $70,969 |
Source: Public Records
Map
Nearby Homes
- 321 W North Ave Unit 133
- 908 Northpoint Place
- 1012 W Anthony Way
- 1249 Westbrook Dr
- 1213 Iris Ct
- 526 N L St
- 1212 Timothy Ct
- 1344 Village Meadows Dr
- 933 Bellflower Ln
- 510 N I St
- 1407 N H St
- 100 California 1
- 1416 Glen Ellen Ln
- 516 N U St
- 610 E Pine Ave Unit 10
- 610 E Pine Ave Unit 29
- 610 E Pine Ave Unit 62
- 701 E Pine Ave Unit 182
- 701 E Pine Ave Unit 176
- 701 E Pine Ave Unit 171
Your Personal Tour Guide
Ask me questions while you tour the home.