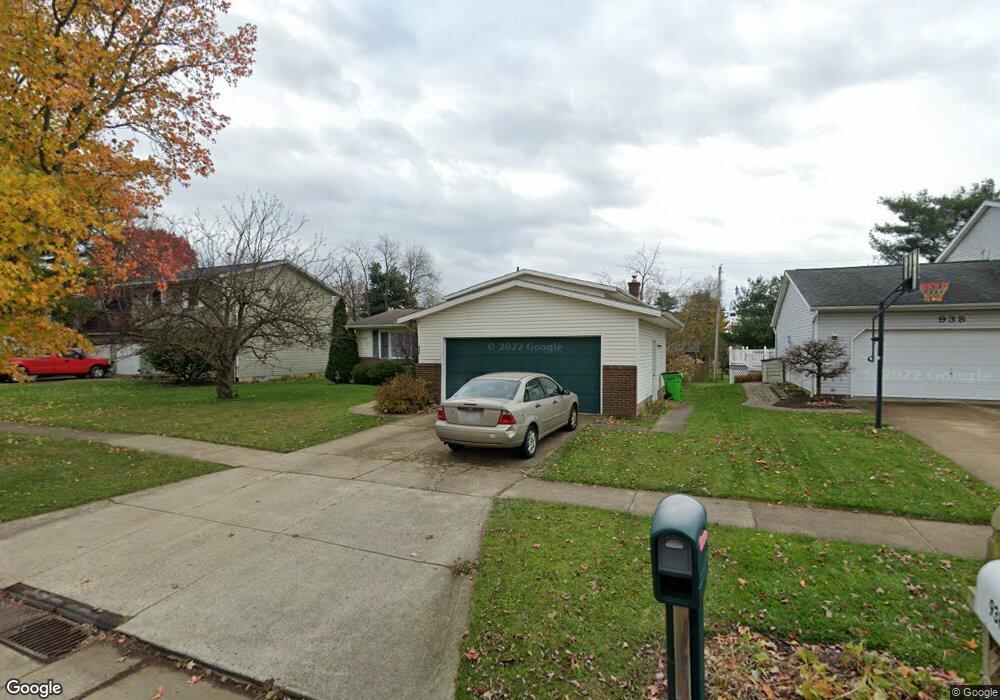
926 Patrick Place Wooster, OH 44691
Estimated Value: $266,838 - $293,000
4
Beds
2
Baths
1,758
Sq Ft
$159/Sq Ft
Est. Value
About This Home
This home is located at 926 Patrick Place, Wooster, OH 44691 and is currently estimated at $278,960, approximately $158 per square foot. 926 Patrick Place is a home located in Wayne County with nearby schools including Parkview Elementary School, Edgewood Middle School, and Wooster High School.
Ownership History
Date
Name
Owned For
Owner Type
Purchase Details
Closed on
Apr 30, 2009
Sold by
Winland Chad D and Winland Michelle L
Bought by
Derflinger Bradley J and Derflinger Angel M
Current Estimated Value
Home Financials for this Owner
Home Financials are based on the most recent Mortgage that was taken out on this home.
Original Mortgage
$130,752
Outstanding Balance
$83,498
Interest Rate
5.05%
Mortgage Type
VA
Estimated Equity
$195,462
Purchase Details
Closed on
Mar 12, 2005
Sold by
Britt Carolyn S and Marsh Charlotte A
Bought by
Winland Chad D and Winland Michelle L
Home Financials for this Owner
Home Financials are based on the most recent Mortgage that was taken out on this home.
Original Mortgage
$116,000
Interest Rate
5.64%
Mortgage Type
Unknown
Purchase Details
Closed on
Nov 18, 1991
Sold by
Wolf Judith A
Bought by
Wolf Donald D
Create a Home Valuation Report for This Property
The Home Valuation Report is an in-depth analysis detailing your home's value as well as a comparison with similar homes in the area
Home Values in the Area
Average Home Value in this Area
Purchase History
| Date | Buyer | Sale Price | Title Company |
|---|---|---|---|
| Derflinger Bradley J | $128,000 | Service 1St Title Agcy | |
| Winland Chad D | $126,000 | Wayne County Title Agency | |
| Wolf Donald D | -- | -- |
Source: Public Records
Mortgage History
| Date | Status | Borrower | Loan Amount |
|---|---|---|---|
| Open | Derflinger Bradley J | $130,752 | |
| Previous Owner | Winland Chad D | $116,000 |
Source: Public Records
Tax History
| Year | Tax Paid | Tax Assessment Tax Assessment Total Assessment is a certain percentage of the fair market value that is determined by local assessors to be the total taxable value of land and additions on the property. | Land | Improvement |
|---|---|---|---|---|
| 2024 | $2,849 | $68,980 | $13,300 | $55,680 |
| 2023 | $2,861 | $68,980 | $13,300 | $55,680 |
| 2022 | $2,624 | $50,350 | $9,710 | $40,640 |
| 2021 | $2,706 | $50,350 | $9,710 | $40,640 |
| 2020 | $2,566 | $50,350 | $9,710 | $40,640 |
| 2019 | $2,115 | $39,840 | $8,570 | $31,270 |
| 2018 | $2,121 | $39,840 | $8,570 | $31,270 |
| 2017 | $2,109 | $39,840 | $8,570 | $31,270 |
| 2016 | $2,205 | $38,350 | $8,570 | $29,780 |
| 2015 | $2,165 | $38,350 | $8,570 | $29,780 |
| 2014 | $2,166 | $38,350 | $8,570 | $29,780 |
| 2013 | $2,152 | $37,660 | $9,670 | $27,990 |
Source: Public Records
Map
Nearby Homes
- 835 Marilyn Dr
- 869 Meadow Ln
- 972 Carriage Ln
- 2185 Ryan Ct
- 2360 Star Dr
- 2447 Wetherington Ln Unit 131
- 2447 Wetherington Ln Unit 130
- 2447 Wetherington Ln
- 2457 Barrington Way Unit 327
- 2457 Barrington Way Unit 325
- 2520 Barrington Way
- 2452 Barrington Way Unit 424
- 2552 Monterey St
- 1704 Carlin Trail
- 1627 Carlin Trail
- 1643 Carlin Trail
- 1942 Fisher Dr
- 211 Oakley Rd
- 1047 Ashwood Dr
- 2011 Burbank Rd
- 922 Patrick Place
- 938 Patrick Place
- 925 Marilyn Dr
- 948 Patrick Place
- 921 Marilyn Dr
- 937 Marilyn Dr
- 914 Patrick Place
- 947 Marilyn Dr
- 933 Patrick Place
- 925 Patrick Place
- 960 Patrick Place
- 941 Patrick Place
- 917 Patrick Place
- 959 Marilyn Dr
- 903 Marilyn Dr
- 953 Patrick Place
- 972 Patrick Place
- 965 Patrick Place
- 971 Marilyn Dr
- 907 Patrick Place
Your Personal Tour Guide
Ask me questions while you tour the home.