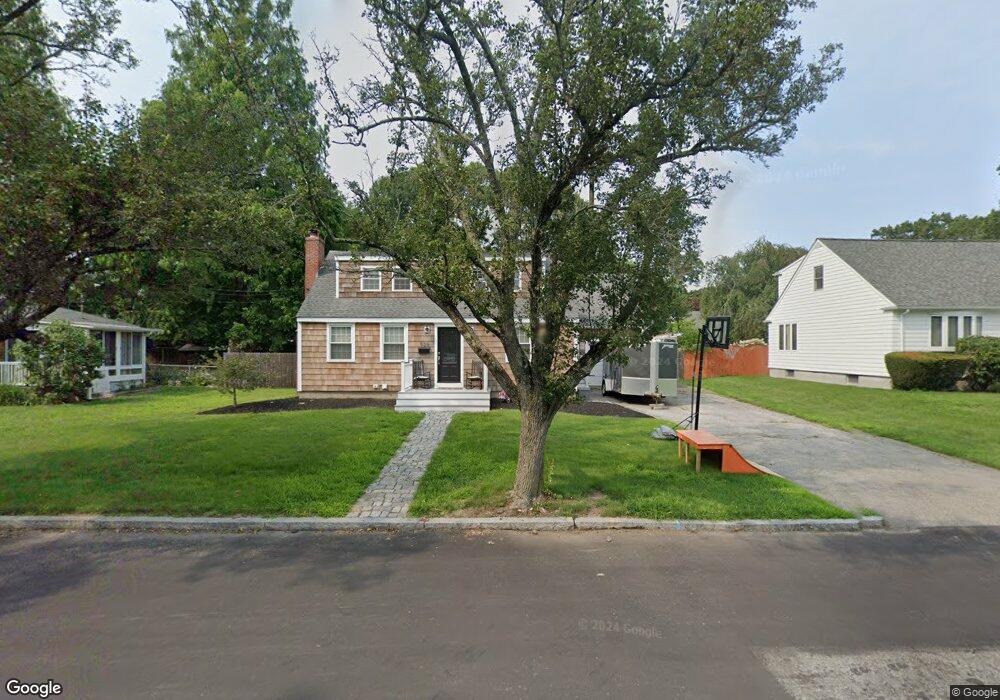
926 Pearce St Fall River, MA 02720
Highlands-Fall River NeighborhoodEstimated Value: $416,154 - $447,000
3
Beds
1
Bath
1,395
Sq Ft
$309/Sq Ft
Est. Value
About This Home
This home is located at 926 Pearce St, Fall River, MA 02720 and is currently estimated at $431,039, approximately $308 per square foot. 926 Pearce St is a home located in Bristol County with nearby schools including Spencer Borden Elementary School, Morton Middle School, and B M C Durfee High School.
Ownership History
Date
Name
Owned For
Owner Type
Purchase Details
Closed on
Jun 13, 2011
Sold by
Burke Timothy M
Bought by
Correia Joel C and Correia Genesis M
Current Estimated Value
Home Financials for this Owner
Home Financials are based on the most recent Mortgage that was taken out on this home.
Original Mortgage
$144,248
Outstanding Balance
$100,278
Interest Rate
4.81%
Mortgage Type
Purchase Money Mortgage
Estimated Equity
$330,761
Purchase Details
Closed on
Sep 16, 2005
Sold by
Est Shea John V and Shea John V
Bought by
Burke Timothy M
Home Financials for this Owner
Home Financials are based on the most recent Mortgage that was taken out on this home.
Original Mortgage
$259,825
Interest Rate
5.84%
Mortgage Type
Purchase Money Mortgage
Create a Home Valuation Report for This Property
The Home Valuation Report is an in-depth analysis detailing your home's value as well as a comparison with similar homes in the area
Home Values in the Area
Average Home Value in this Area
Purchase History
| Date | Buyer | Sale Price | Title Company |
|---|---|---|---|
| Correia Joel C | $148,000 | -- | |
| Burke Timothy M | $273,500 | -- |
Source: Public Records
Mortgage History
| Date | Status | Borrower | Loan Amount |
|---|---|---|---|
| Open | Correia Joel C | $144,248 | |
| Previous Owner | Burke Timothy M | $259,825 |
Source: Public Records
Tax History
| Year | Tax Paid | Tax Assessment Tax Assessment Total Assessment is a certain percentage of the fair market value that is determined by local assessors to be the total taxable value of land and additions on the property. | Land | Improvement |
|---|---|---|---|---|
| 2025 | $3,871 | $338,100 | $145,400 | $192,700 |
| 2024 | $3,673 | $319,700 | $139,800 | $179,900 |
| 2023 | $3,606 | $293,900 | $120,900 | $173,000 |
| 2022 | $3,266 | $258,800 | $113,000 | $145,800 |
| 2021 | $3,243 | $234,500 | $113,400 | $121,100 |
| 2020 | $3,152 | $218,100 | $113,600 | $104,500 |
| 2019 | $3,158 | $216,600 | $115,400 | $101,200 |
| 2018 | $3,227 | $220,700 | $121,800 | $98,900 |
| 2017 | $2,986 | $213,300 | $116,000 | $97,300 |
| 2016 | $2,876 | $211,000 | $118,400 | $92,600 |
| 2015 | $2,573 | $196,700 | $104,100 | $92,600 |
| 2014 | $2,474 | $196,700 | $104,100 | $92,600 |
Source: Public Records
Map
Nearby Homes
- 301 Madison St
- 108 Garden St
- 499 Hanover St
- 1231 Robeson St
- 65 Bigelow St
- 503 Highland Ave
- 742 New Boston Rd
- 25 O'Hearn St
- 545 Robeson St
- 45-47 Shawmut St
- 213 Weetamoe St
- 909 High St Unit 1
- 889 High St
- 267 Lincoln Ave
- 27 Kane St
- 677 Oak Grove Ave
- 295 Newbury St
- 208 Florence St
- 72 Belmont St
- 160 Stewart St
Your Personal Tour Guide
Ask me questions while you tour the home.